Figure 1.

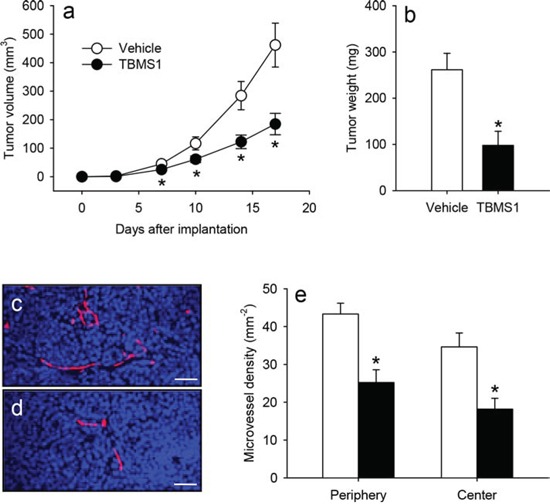
a. Volume (mm3) of developing NCI-H460 flank tumors in vehicle-treated (white circles) and TBMS1-treated CD1 nu/nu mice (black circles), as assessed by means of a digital caliper at the day of tumor induction (d0) as well as at day 3, 7, 10, 14 and 17. b. Final weight (mg) of the vehicle-treated (white bar) and TBMS1-treated tumors (black bar) at day 17. The data were quantified from 8 mice per group. Means ± SEM. *P<0.05 vs. vehicle. c, d. Immunohistochemical detection of newly formed microvessels in the center of a tumor from a vehicle-treated control mouse (c) and a TBMS1-treated animal (d) at day 17. Sections were stained with Hoechst 33342 to identify cell nuclei (blue) and an antibody against CD31 for the detection of the microvascular endothelium (red). Scale bars: 45μm. e. Microvessel density (mm−2) in the periphery and the center of vehicle-treated (white bars) and TBMS1-treated tumors (black bars) at day 17. The data were quantified from 8 mice per group. Means ± SEM. *P<0.05 vs. vehicle.
