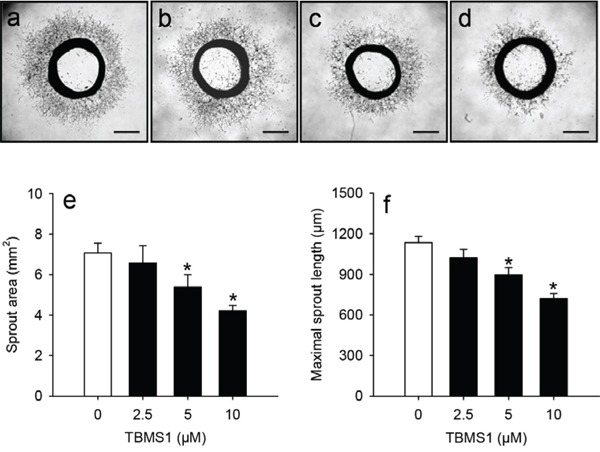
Figure 2.

a-d. Phase contrast microscopic images of rat aortic rings exposed for 6 days to vehicle (0μM; a), 2.5 (b), 5 (c) and 10μM TBMS1 (d). Scale bars: 1mm. e, f. Sprout area (mm2) (e) and maximal sprout length (μm) (f) of the outer aortic vascular sprouting at day 6 after incubation of aortic rings, as assessed by computer-assisted image analysis. The rings were exposed to vehicle (0μM; white bars) and 2.5, 5 and 10μM TBMS1 (black bars). The data were quantified from 8 aortic rings per group. Means ± SEM. *P<0.05 vs. vehicle.
