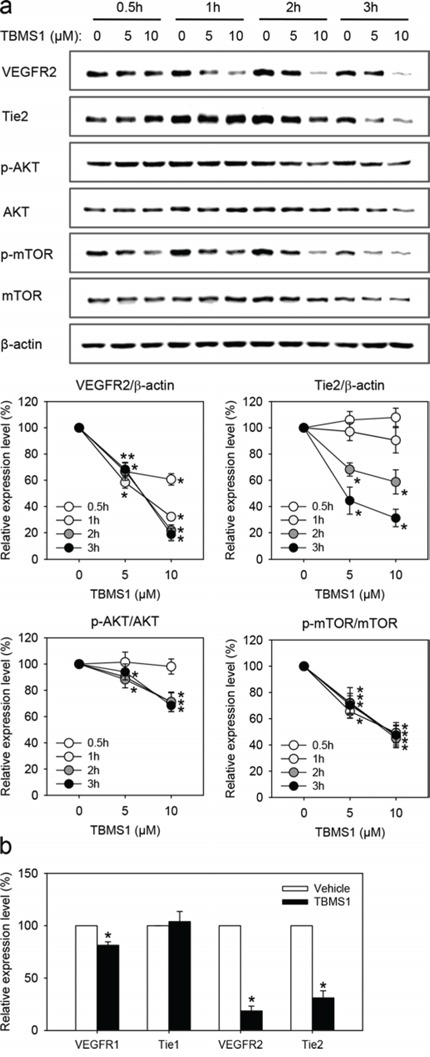
Figure 5.

a. Western blot analysis of VEGFR2, Tie2, p-AKT/AKT and p-mTOR/mTOR expression of eEND2 cells (% of control at each time point), which were treated for 0.5h (white circles), 1h (light grey circles), 2h (dark grey circles) and 3h (black circles) with vehicle (0μM; control), 5 and 10μM TBMS1. The data were quantified from 3 independent experiments. Means ± SEM. *P<0.05 vs. vehicle. b. Western blot analysis of VEGFR1, Tie1, VEGFR2 and Tie2 expression of eEND2 cells (% of control), which were treated for 3h with vehicle (0μM; control) or 10μM TBMS1. The data were quantified from 3 independent experiments. Means ± SEM. *P<0.05 vs. vehicle.
