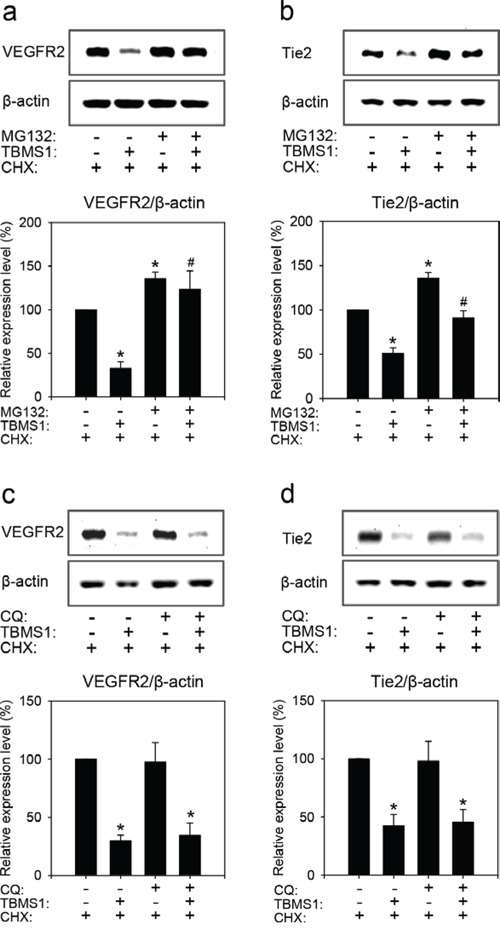
Figure 7.

Western blot analysis of VEGFR2 (a, c) and Tie2 (b, d) expression of eEND2 cells (% of control). The cells were pretreated without or with 30μM MG132 or 100μM CQ for 2h, and then incubated with vehicle (distilled water) or 10μM TBMS1 in the presence of 100μM CHX for another 1h (a, c) or 4h (b, d). The data were quantified from 3 independent experiments. Means ± SEM. *P<0.05 vs. vehicle + CHX (control); #P<0.05 vs. TBMS1 + CHX.
