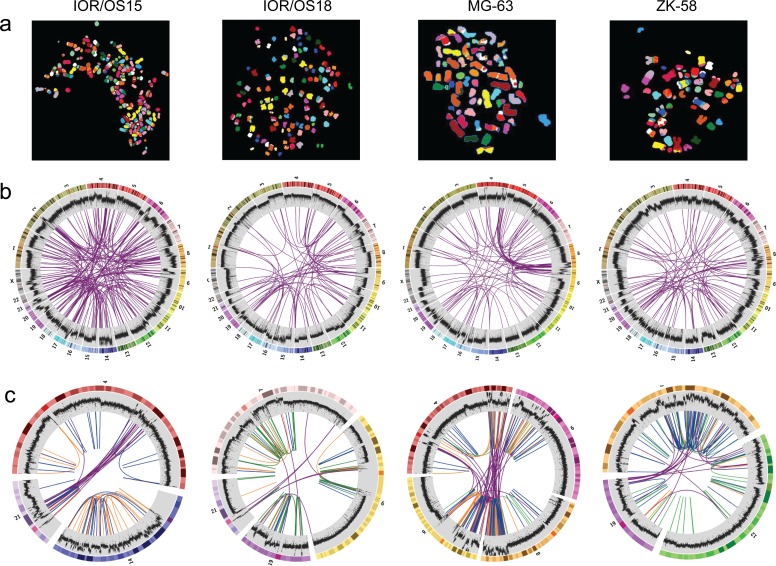
Figure 1. Visualization of the genomic chaos in osteosarcoma.
a. Example single cell multicolor spectral karyotypes for each cell line demonstrating the genomic complexity and high numbers of translocations. b. Circos plots showing genome-wide interchromosomal translocations (purple lines) identified by WGS with allele frequencies of ≥10 %. The outermost circles illustrate the chromosome idiograms followed by the plot of the genome coverage (binary logarithmic scale ranging from 2 (log24) to 8 (log2256), increasing from center towards periphery, 50K window size). Changes in coverage indicate copy number variations with increase indicating gain and decrease indicating loss. c. Circos plots of rearrangement clusters showing chromothripsis-like characteristics of breakpoint distribution within certain chromosomes. Purple lines indicate translocations, orange lines inversions, green lines duplications and blue lines deletions. The coverage plot illustrates high local increase of the copy number, which does not support the copy number neutral chromothripsis model.

