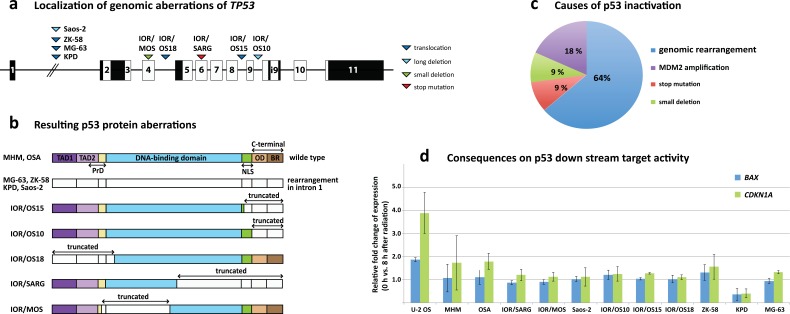
Figure 4. TP53 aberrations in osteosarcoma cell lines.
a. Genomic localization of aberrations across TP53 with triangles demonstrating the position of the aberrations for the different cell lines and the aberration type (dark blue = translocation, light blue = long deletion, green = small deletion, red = stop mutation). b. Visualization of the consequences of the TP53 aberrations at the protein level. The different protein domains are indicated (TAD = transactivation domain, NLS = nuclear localization signal, OD = oligomerization domain, BR = basic region). Uncolored regions of the protein represent truncated parts. c. The distribution of the various causes of p53 inactivation clearly shows that rearrangements in TP53 are the major factor with 64 % followed by MDM2 amplifications, small deletions and mutations. d. Results of the radiation-induced DNA damage assay showing the fold change of BAX and CDKN1A expression 8 hours after induction. U-2 OS is known to harbor wild-type p53 and was used as control.

