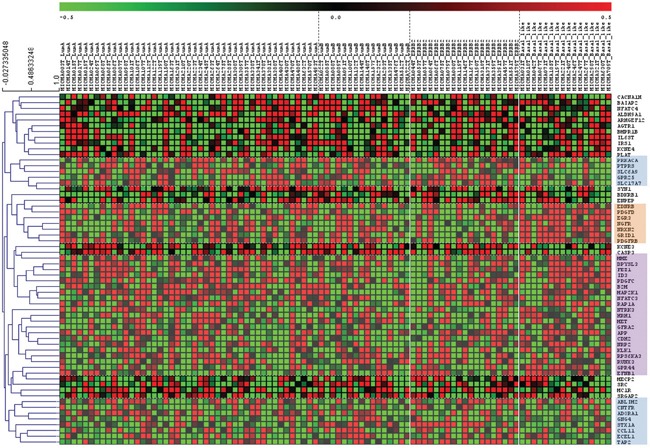
Figure 3. Neurogenes expression among breast cancer subtypes (MicMa Database) Tumor gene expression levels for 96 patients with different breast cancer subtypes.

Rows represent microarray probes corresponding to the selected genes (neurogenes differentially expressed in CD44+ cells) and columns represent patients. 3 independent gene set were identified and gathered. Orange square: genes upregulated in basal like patients: EDNRB, PDGFD, EGR3, NGFR, NRXN2, GRID1, PDGFRB. Blue squares: genes downregulated in basal like patients and upregulated in HER-2 enriched patients: PRKACA, PTPRES, SLC6A9, GPR25, SLC17A7, ABLIM2, CNTFR, ADORA1, GNG4, STX1A, CCL11, ECEL1, TAP2. Violet square: genes upregulated in basal and HER2-enriched patients: MME, DPYSL3, FEZ1, ID3, PDGFC, B2M, MAP2K1, NFATC3, RAP1A, NTRK3, HRH1, MET, GFRA2 APP, CDH2, NRP2, KLK1, RPS6KA3, RUNX3, GPR44, EFNB1. Red and green indicate high and low expression levels, respectively.
