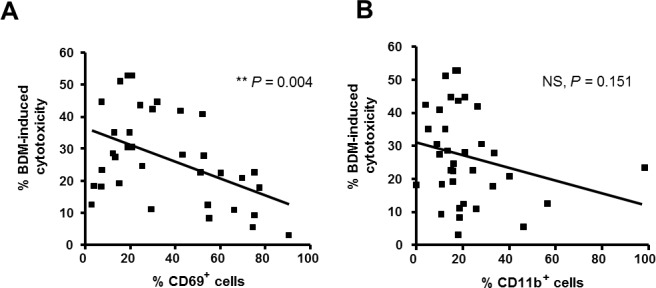
Figure 2. Association of CD69 surface levels with response to bendamustine.

Basal percentages of CD69+ A. and CD11b+ B. CLL cells were quantified by flow cytometry in 35 CLL cases and correlation with response rates to bendamustine 25 μM at 24 hours was analyzed. BDM, bendamustine; **, P < 0.01; NS, not significant.
