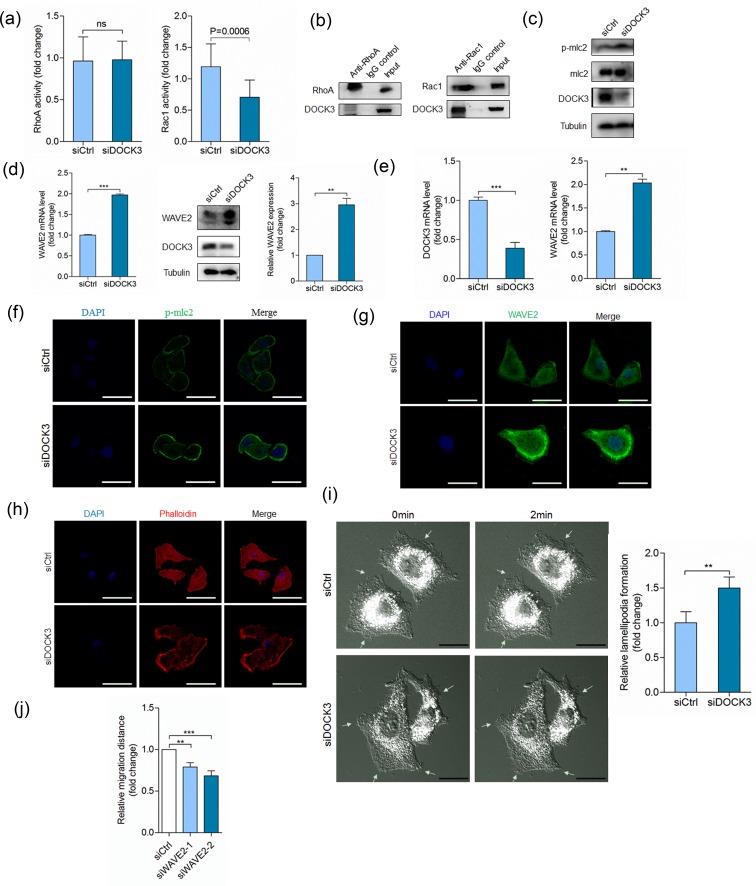
Figure 4. DOCK3 inhibits WAVE2 expression.
a. Quantification of RhoA (left panel) and Rac1 (right panel) activation in HuH-7 cells transfected with siDOCK3 or siCtrl at 48 h after transfection. ns p > 0.05 by student's t-test. b. Co-immunoprecipitation of endogenous RhoA (left panel) or Rac1 (right panel) with DOCK3. c. HuH-7 cells transfected with siDOCK3 or siCtrl were analyzed for p-mlc2 and DOCK3 by Western blot at 48 h after transfection. d. HuH-7 cells transfected with siDOCK3 or siCtrl were analyzed for WAVE2 by relative quantitative real-time RT-PCR (left panel) and Western blot (right panel) at 48 h after transfection. ***p < 0.001 by student's t-test. e. Relative quantitative real-time RT-PCR analysis of DOCK3 (left panel) and WAVE2 (right panel) in A549 cells transfected with siDOCK3 or siCtrl at 48 h after transfection. ***p < 0.001, **p < 0.01 by student's t-test. f.-h. Confocal microscopy images of p-mlc2 expression (f), WAVE2 expression (g) and actin cytoskeleton rearrangement (h) in A549 cells transfected with siDOCK3 or siCtrl at 48 h after transfection. i. DIC microscopy images of A549 cells transfected with siDOCK3 or siCtrl at 48 h after transfection. Arrows indicate lamellipodium dynamics. **p < 0.01 by student's t-test. j. Quantitative analysis of relative migration distance. ***p < 0.001, **p < 0.01 by ANOVA. Error bars indicate the standard deviations (SD) from at least triplicate determinations (n > 3)

