
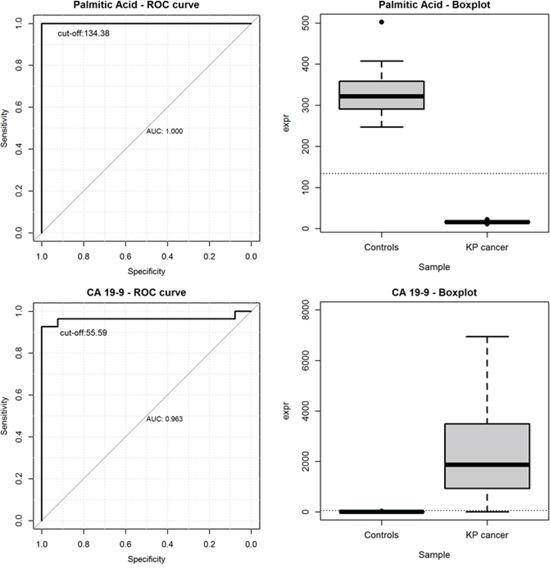
Figure 6. ROC curves and the boxplots of metabolite levels for palmitic acid (upper left and upper right) and for CA 19-9 (bottom left and bottom right).
Official websites use .gov
A
.gov website belongs to an official
government organization in the United States.
Secure .gov websites use HTTPS
A lock (
) or https:// means you've safely
connected to the .gov website. Share sensitive
information only on official, secure websites.