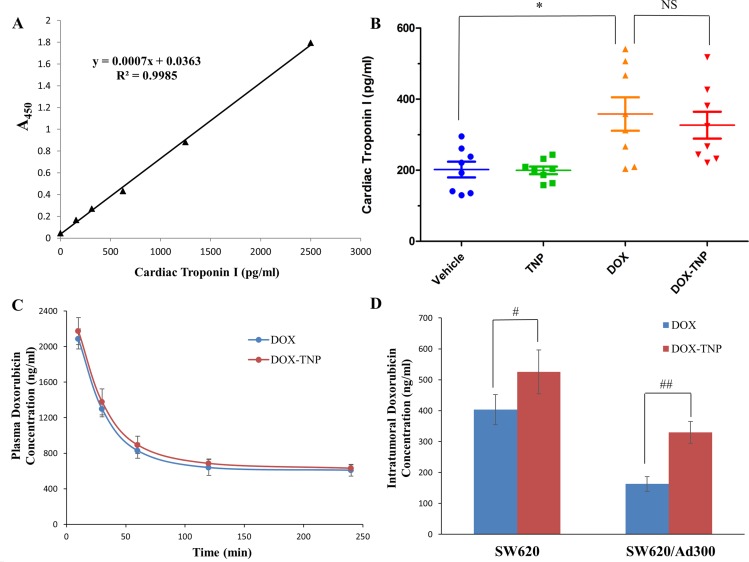
Figure 5.
(A) The effect of DOX, TNP and DOX-TNP on the levels of cardiac troponin I in nude athymic mice. The standard curve illustrating the relationship between the absorbance value (A450) and the levels of cardiac troponin I (pg/ml). (B) The changes in mean levels of cardiac troponin I in nude mice (n = 8) at the end of the 18-day treatment period. *P < 0.05 versus the vehicle group; NS, not statistically significant (P > 0.05). (C) Plasma doxorubicin concentrations in nude athymic mice at 10, 30, 60, 120, 240 min following administration of DOX or DOX-TNP (n = 8). (D) Intratumoral doxorubicin concentrations in SW620 (n = 8) and SW620/Ad300 tumors (n = 8) after 240 min following administration of DOX or DOX-TNP. Columns and error bars represent mean ± SEM. #P < 0.05 versus the DOX group; ##P < 0.01 versus the DOX goup.

