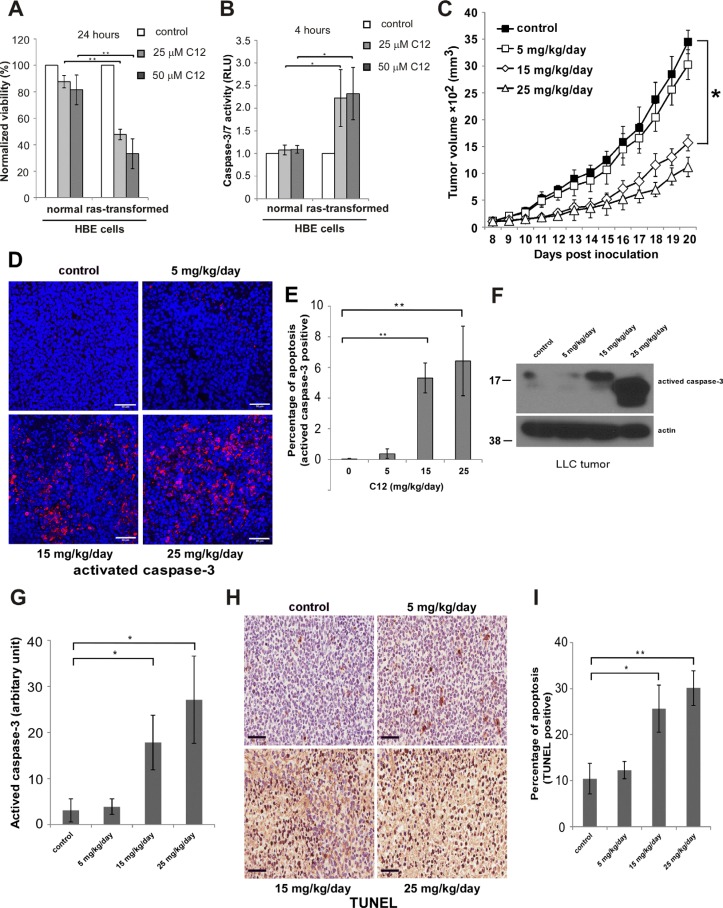
Figure 1. C12 inhibits LLC tumor growth and induces tumor cell apoptosis in vivo in a dose-dependent fashion.
(A–B) Cytotoxicity of C12 is affected by oncogenic transformation. C12's effects on HBE cell viability (A) and caspase-3/7 activation (B) were examined. All data shown are mean ± standard deviation of 3 independent experiments. Asterisk indicates P < 0.05 (*) or P < 0.01 (**) by student's unpaired t test. (C) The inhibitory effects of C12 on the growth of LLC tumors were studied. Tumors were measured daily and tumor tissues were removed at the end of treatments. Data are shown as mean ± standard deviation of tumor volumes of 7 animals in either vehicle control or C12-treated group. Asterisk indicates P < 0.05 (*) by student's unpaired t test. (D) Apoptotic cells in tumor sections were detected by immunofluorescence staining of activated caspase-3. Representative images of tumor sections are shown. Scale bar, 50 μm. (E) The percentage of activated caspase-3 shown in (D) was quantified using ImageJ software (NIH). Data are mean ± standard deviation of three independent tumor sections. Asterisk indicates P < 0.01 (**) by student's unpaired t test. (F) Expression of activated caspase-3 in tumor tissues was analyzed by western blot. (G) The relative expression levels of activated caspase-3 shown in (F) were quantified by measuring intensities of western blot signals using ImageJ software and presented as arbitrary units. Data are mean ± standard deviation of three independent tumor samples. Asterisk indicates P < 0.05 (*) by student's unpaired t test. (H) TUNEL staining of apoptotic cells in control or C12-treated tumor sections. Representative images are shown. Scale bar, 60 μm. (I) The percentage of apoptotic cells shown in (H) was quantified using ImageJ software. Data are mean ± standard deviation of three independent tumor sections. Asterisk indicates P < 0.05 (*) or P < 0.01 (**) by student's unpaired t test.

