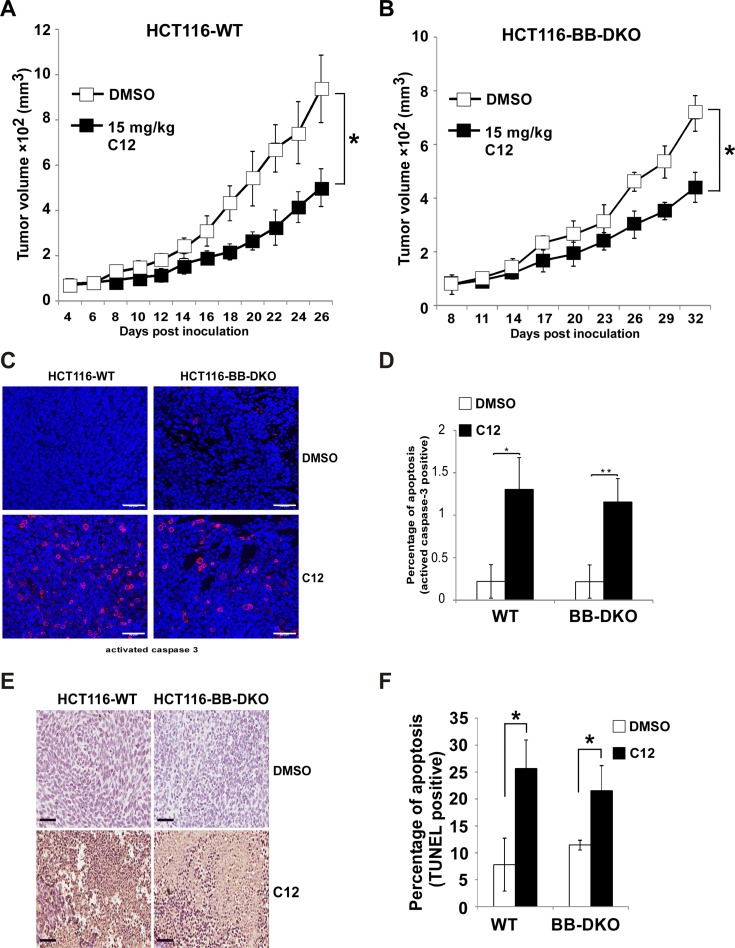
Figure 5. C12 inhibits xenografted tumor growth independent of Bak and Bax.
(A–B) Growth of HCT116-WT tumors (A) and HCT116-Bak/Bax-DKO tumors (B) in athymic nude mice treated with vehicle control or C12 (15 mg/kg/day). Data are mean ± standard deviation of tumor volumes of 8 animals in each group. (C) Apoptotic cells in tumor sections were detected by immunofluorescence staining of activated caspase-3. Representative images of tumor sections from DMSO- and C12-treated mice are shown. Scale bar, 50 μm. (D) The percentage of activated caspase-3 shown in (C) were quantified. Data are mean ± standard deviation of three independent tumor sections. Asterisk indicates P < 0.05 (*) or P < 0.01 (**) by student's unpaired t test (E) Typical TUNEL labeling images of tumor sections from vehicle control- and C12-treated mice are shown. Scale bar, 60 μm. (F) The percentage of TUNEL-positive cells in tumors of C12-treated mice is higher than that of control mice. All data are mean ± standard deviation of three independent tumor sections. Asterisk indicates P < 0.05 (*) by student's unpaired t test.

