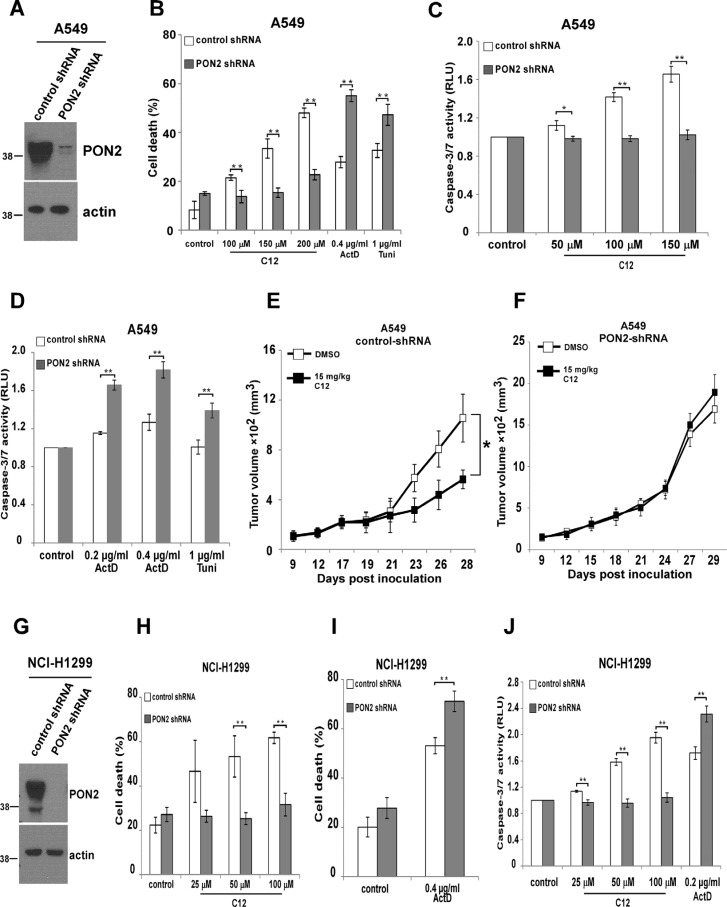
Figure 8. PON2 is required in C12's cytotoxicity on tumor cells and inhibitory effects on tumor growth.
(A) PON2 expression in A549 cells was stably reduced by shRNA. The expression levels of PON2 were determined by western blot. (B) C12 induced less apoptosis in A549 cells with reduced PON2 expression than in control vector cells, which is opposite to the effects of actinomycin D or tunicamycin. Cell death was assessed after 32 hour incubation. (C) Upon treatment with different doses of C12 for 32 hours, less caspase-3/7 activation was detected in cells with reduced PON2 expression than control vector cells. (D) Actinomycin D or tunicamycin induced more caspase-3/7 activation in A549 cells with higher PON2 expression following 48 hour treatment. (E-F) Growth of A549-vector tumors (E) and A549 tumors with reduced PON2 expression (F) in athymic nude mice treated with vehicle control or C12 (15 mg/kg/day). Data are mean ± standard deviation of tumor volumes of 7 animals in each group. Asterisks indicate P values of < 0.05 (*) by student's unpaired t test. (G) Stable reduction of PON2 expression in NCI-H1299 cells was evaluated by western blot. (H) C12 induced less cell death in NCI-H1299 cells with reduced PON2 following 24 hour treatment. (I) More cell death was detected in NCI-H1299 cells with lower PON2 expression following 24 hour exposure of actinomycin D. (J) Less apoptosis was detected in NCI-H1299 cells with reduced PON2 expression than control vector cells induced by C12, which is opposite to the effect of actinomycin D. Cell death was assessed after 24 hour incubation. All data shown are mean ± standard deviation of three independent experiments performed in triplicate. Asterisks indicate P values of < 0.05 (*) or < 0.01 (**) by student's unpaired t test.

