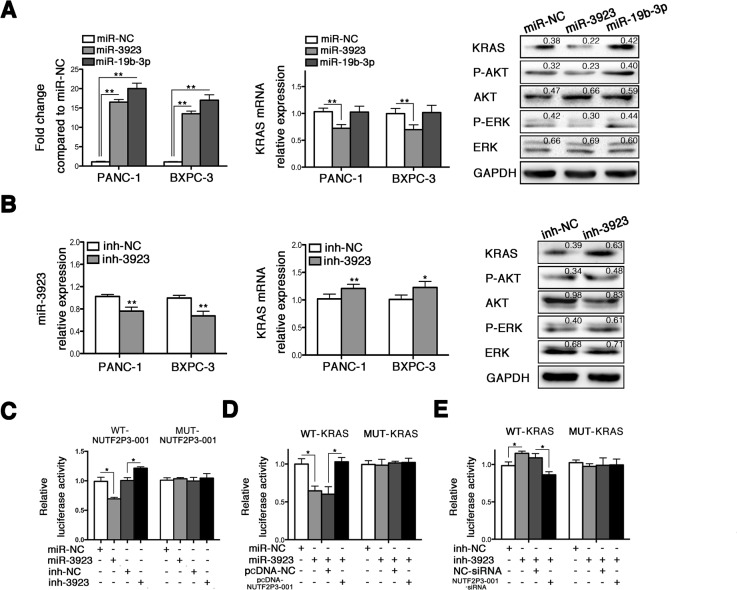
Figure 3. LncRNA-NUTF2P3-001 and 3′UTR of KRAS mRNA could competitively bind with miR-3923.
(A) The expression of miR-3923 and miR-19b was remarkably increased after transfection with miR-3923 mimics (miR-3923, 50 nM) and miR-19b-3p mimics (miR-19b-3p, 50 nM) respectively, and the miR-NC was designated as value of 1. Only miR-3923 but not miR-19b-3p could decrease KRAS mRNA expression. The expression of KRAS and downstream proteins were detected in PANC-1 treated with miR-3923. MiR-3923 leaded to downregulated KRAS, p-AKT/AKT and p-ERK/ERK in PANC-1 cells. Relative intensity value is marked. (B) MiR-3923 was obviously decreased by transfection with miR-3923 inhibitor (inh-3923, 100 nM) and further lead to elevated level of KRAS in mRNA level. The expression of KRAS and downstream proteins were detected in PANC-1. Enhanced KRAS, elevated p-AKT/AKT and p-ERK/ERK were detected in PANC-1 cells. Relative intensity value is marked. (C) NUTF2P3-001 luciferase activity assays. Wide type or mutant NUTF2P3-001 was co-transfected with miR-3923 (50 nM) or inh-3923 (100 nM), respectively. MiR-3923 repressed, but inh-3923 enhanced the luciferase activity of the WT-NUTF2P3-001 reporter which including wild type sequence of NUTF2P3-001. There was no obvious change of the luciferase activity for the MUT-NUTF2P3-001 reporter which containing mutant NUTF2P3-001 sequence. (D) KRAS 3′UTR luciferase activity assays. Overexpression of NUTF2P3-001 with pcDNA-NUTF2P3-001 (0.2 μg per well in 96-well plate) rescued the luciferase activity, which repressed by the transfection with miR-3923 (50 nM) in the WT-KRAS but not in the MUT-KRAS reporter. (E) Downregulation of NUTF2P3-001 with NUTF2P3-001-siRNA (50 nM) reversed the luciferase activity, which enhanced by the transfection with inh-3923 (100 nM) in the WT-KRAS but not in MUT-KRAS reporter. The normalized luciferase activity in the control group was set to 1. All data were presented as means ± SD of at least three independent experiments. The p-value represents the comparison between groups (*p < 0.05, **p < 0.01).

