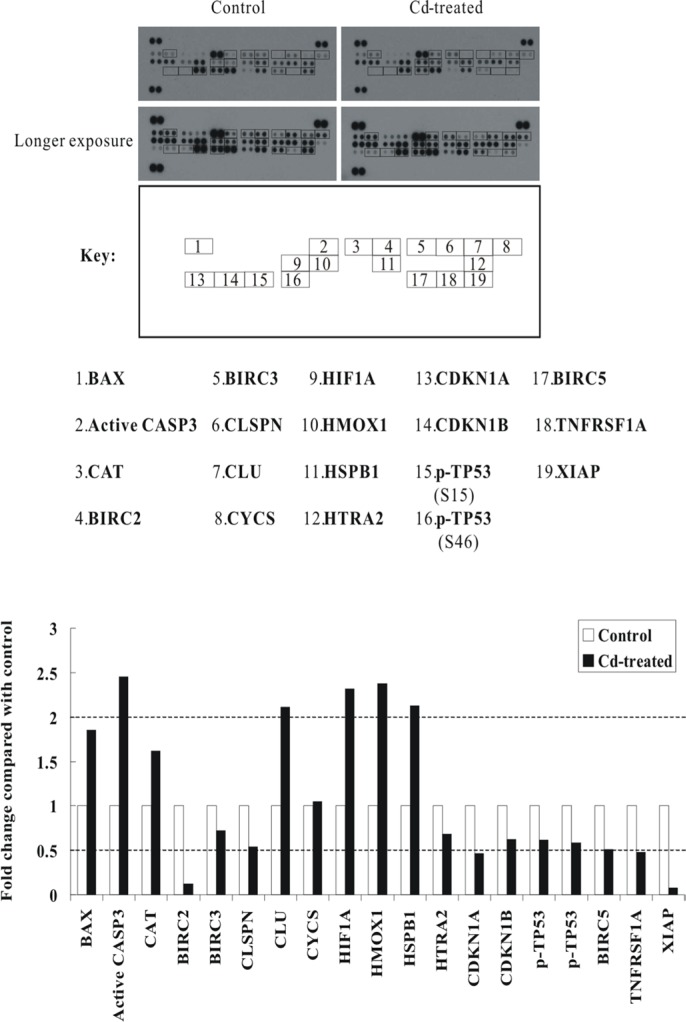
Figure 3. Alterations of apoptosis-related proteins in Cd-treated BEAS-2B cells.
Protein extract (400 μg) were used for apoptosis array analysis. Array spots were visualized in accordance with the manufacturer's instructions. The intensity of each spot was measured as described in “Materials and Methods”. The graph shows the relative fold change of proteins with significant difference upon Cd treatment, setting 1 for control (no treatment of Cd). Protein levels with higher than ± 2 folds (i.e. ≥ 2 or ≤ 0.5 as indicated by dotted lines) are considered as candidates that are more importantly participated in the Cd toxicity pathway. The data are shown as an average of two individual sets of sample.

