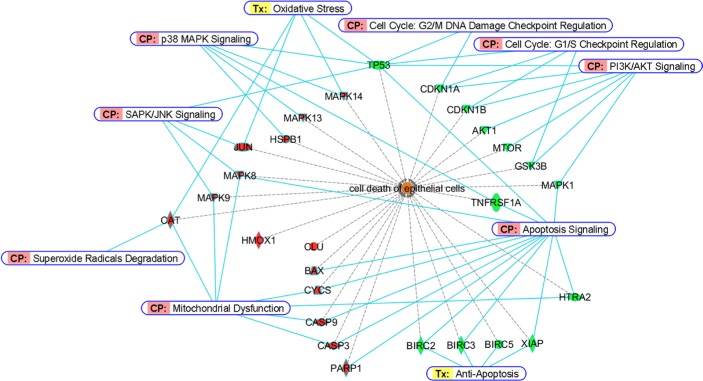
Figure 7. Bioinformatic analyses of differentially-expressed proteins from BEAS-2B cells dosed with Cd.
Proteins involved in cell death of epithelial cells were classified by Diseases and Bio Functions Annotation from Ingenuity® Pathway Analysis. Red and green colors represent stimulated or inhibited protein expressions/activities, respectively. For CASP9, CASP3 and PARP1, red colors indicate an increase of their cleavage products. Canonical Pathway (CP) and Ingenuity® Tox List (Tx) were also annotated (solid blue lines) to indicate the specific pathway/related biological process among these proteins.

