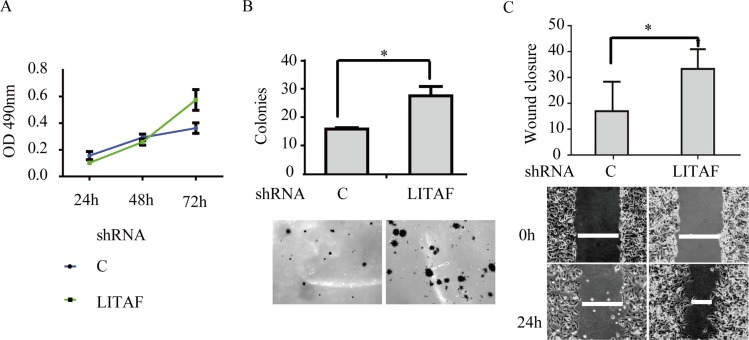
Figure 6. The effect of LITAF knockdown on cellular behavior of A549 cells.
(A) MTT assay. The cells were subjected to MTT assay for up to 72 h. (B) Colony formation assay. The cells were assayed for anchorage-independently growth on soft agar. (C) Wound-healing assay. The graphs represent quantitative data. Averages of a triplicate experiment were plotted (mean ± SD, n = 3), student t test, *p < 0.05.

