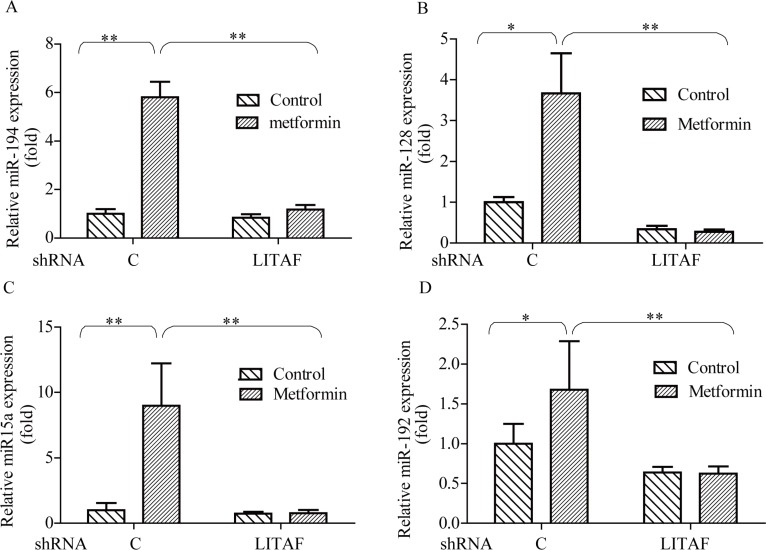
Figure 7. Effect of LITAF on miRNA regulation.
A549 cells with or without LITAF shRNA were treated with metformin (10 mM) for 24 hours and total RNA was isolated for qRT-PCR analysis of miRNAs, miR-194, miR-128, miR-15a, and miR-192. Each sample was amplified in triplicate and normalized to U6 expression. Results were evaluated by the comparative threshold cycle value method for relative quantification of gene expression. Graphs represent mean ± SD (n = 3), student t test,*p < 0.05, **p < 0.01.

