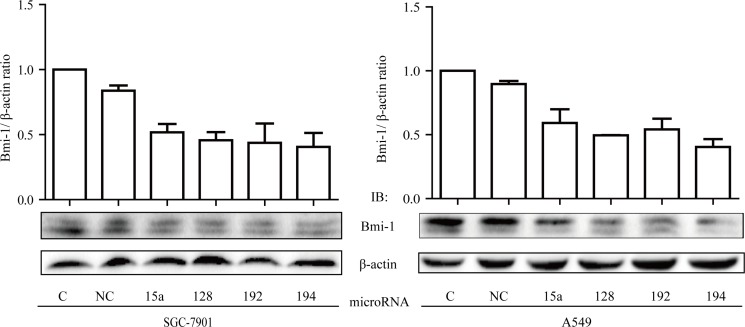
Figure 8. Inhibitory effect of miRNAs on Bmi-1 expression.
(A) SGC-7901 cells and A549 cells were transfect with miR-15a, miR-128, miR-192, and miR-194, respectively, as compared to control cells (C, non-transfected; NC, negative control mimic). Two days later, cells were harvested and extracts subjected to Western blot analysis of Bmi-1. Upper: graphs represent averages of scan densitometry units of each sample in a triplicate experiment that is normalized to β-actin. Lower: representatives of Western blots.

