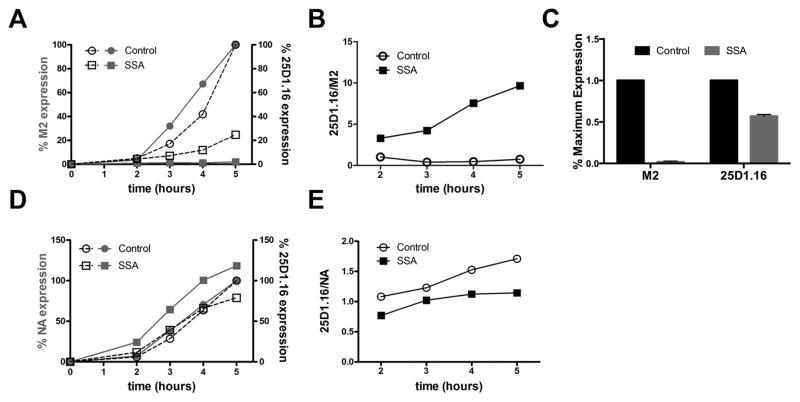
Fig. 2. Kb-SIIN generation persists despite near complete SSA-inhibition of M2 expression.
(A) Flow cytometric analysis of cell surface levels of M2 (red) and Kb-SIINFEKL (black) in L-Kb cells at indicated time after infection with PR8 M2-SIIN in the presence of SSA (squares) or vehicle control. 100% = 5 h vehicle levels.
(B) 25D1.16/M2 ratio calculated from experiment in panel A.
(C) Graph showing ratios of M2 or SIINFEKL expression as determined by flow cytometry 20 h p.i. with PR8 M2-SIIN of HeLa-Kb cells.
(D, E) As in panel A and B, but using PR8 NA-SIIN to infect L-Kb cells.
All experiments were performed at least three times.

