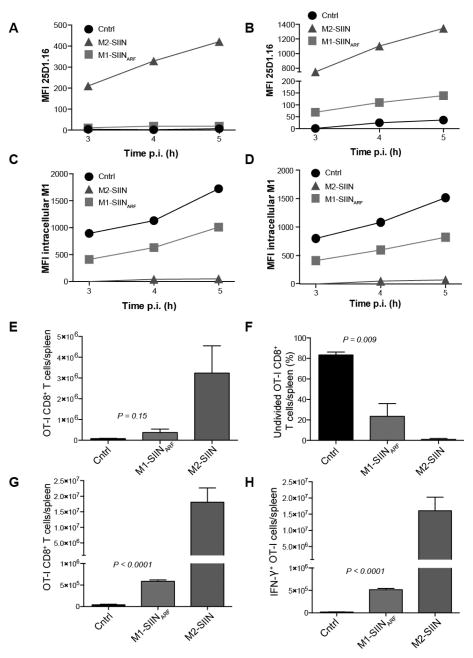
Fig. 7. Generation of Kb-SIINFEKL in cells and mice from VV-mRNA +1 translation.
Flow cytometric analysis of L-Kb cell surface Kb-SIINFEKL expression (A–B) or intracellular M1 (C–D) after infection with recombinant vaccinia virus expressing M2-SIIN, M1-SIINARF or M1 lacking SIIN (control). In B and D, cells were treated for 48 h with IFN-γ prior to infection to up-regulate the antigen processing machinery and increase antigen presentation. (E) OT-I CD8+ cells per spleen 60 h.p.i. with control (black), M1-SIINARF (red), or M2-SIIN (blue) rVV. (F) Undivided OT-I CD8+ cells per spleen 60 h.p.i as indicated by failure to dilute CFSE signal. (G) OT-I CD8+ cells per spleen at 5 d.p.i. (H) Interferon-γ+ OT-I CD8+ T cells determined by intracellular cytokine staining. Bars represent 3–4 mice/group. Error bars = SEM. Statistics = students two-tailed t test.
All experiments were performed at least three times.

