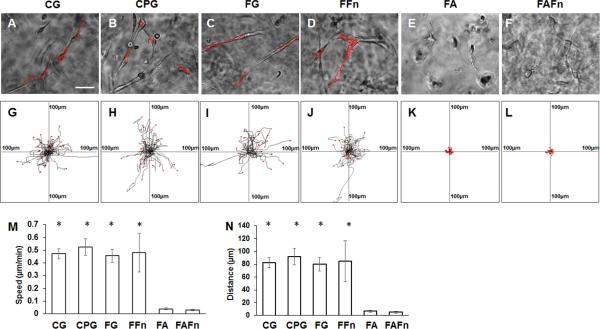
Figure 6.
Migration of astrocytes in hydrogels: (A–F) astrocytes migrated in hydrogels (red lines indicate tracks of migration of astrocytes in hydrogels). Scale bar: 50 μm; (G–L) cell migration paths determined by video monitor tracings (position of all cells at t = 0 min represented by origin position (center of frame), with migratory track of each cell at 3 hours plotted as single line on graph; each arm of axes represents 100 μm of translocation distance); (A, G) collagen hydrogel without crosslinking; (B, H) collagen hydrogel crosslinked with 4S-StarPEG (0.05 mM); (C, I) fibrin hydrogel without aprotinin; (D, J) fibrin hydrogel with fibronectin (25 μg/ml); (E, K) fibrin hydrogel with aprotinin (40 μg/ml); (F, L) fibrin hydrogel with fibronectin (25 μg/ml) and aprotinin (40 μg/ml); (M) quantification of cell migration speed in hydrogels; (N) quantification of cell migration distance in hydrogels. *p < 0.05, compared with astrocyte migration in FA or FAFn. CG = collagen hydrogel; CPG = crosslinked collagen hydrogel; FG = fibrin hydrogel; FFn = fibrin hydrogel containing fibronectin; FA = fibrin hydrogel containing aprotinin; FAFn = fibrin hydrogel containing aprotinin and fibronectin.

