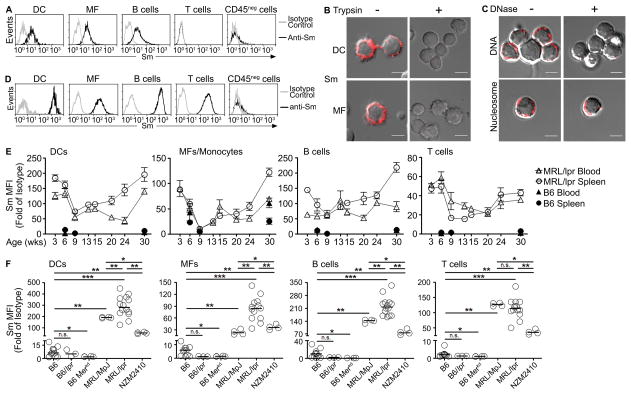
Figure 1. Nuclear self-antigens are displayed on the surface of hematopoietic cells.
(A) Splenic DCs, MFs, B cells, T cells, and CD45neg cells from B6 mice were stained with anti-Sm (2.12.3, black line) or isotype control antibody (gray line) and analyzed by flow cytometry. Representative histograms from >5 experiments (n = >20 mice). (B) Splenic DCs or MFs untreated or treated with trypsin and stained for Sm (2.12.3, red). (C) Splenocytes untreated or treated with DNase (100 μg/ml) were stained for surface DNA (33H11, red) or nucleosome (PL2-3, red). Representative images from 6 experiments (n = 7 mice, 10–15 cells per mouse). Scale bar = 3.5μm. (D) Splenic DCs, MFs, B cells, T cells, and CD45neg cells from MRL/lpr mice (16–28 weeks old) were stained for Sm and analyzed by flow cytometry. Representative data from >5 experiments (n = >20 mice). (E) Splenocytes (circle) or blood cells (triangle) from B6 (black) or MRL/lpr (white) at different ages were stained for Sm and analyzed by flow cytometry. (n = 4–5 mice per age group, 2 experiments). (F) Surface Sm levels were quantitated on splenocytes from different mouse models. (n = 3–14 mice). In (E) results are mean ± SEM. In (F), bars represent median. *p<0.05, **p<0.01, ***p<0.001, n.s. = not significant by Mann-Whitney test. MFI = Median fluorescence intensity.

