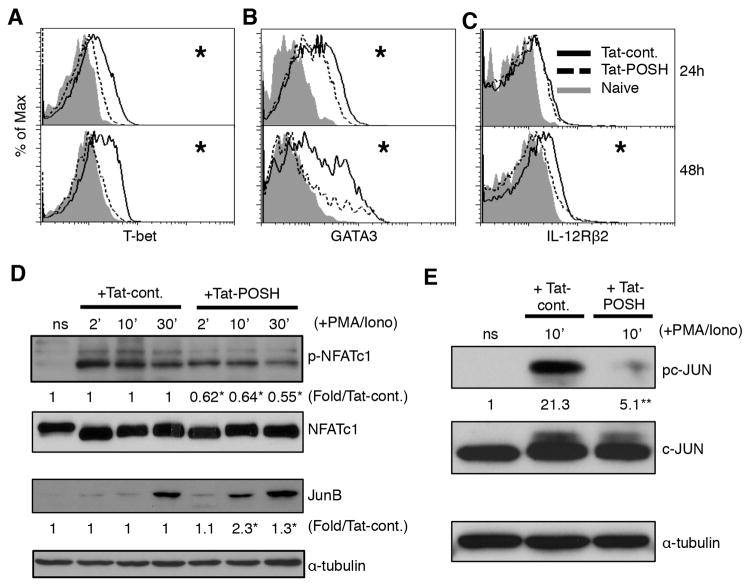
Figure 3. Disruption of POSH leads to a transcriptional profile that favors TH2.
(AC) Naïve CD4+ T cells treated with Tat-POSH or Tat-cont. and stimulated with α-CD3 and α-CD28 in the presence of IL-2 for 24 or 48 hours and the levels of T-bet (A), GATA3 (B) and IL-12Rβ2 (C) were determined by flow cytometry. (D) Naïve CD4+ T cells were treated with Tat-POSH or Tat-cont. and stimulated with PMA/Iono and the level of p-NFATc1, NFATc1, JunB and β-actin were determined by immunoblotting. (E) Cells were stimulated as in (D) and pc-JUN and c-JUN were measured by immunoblot. All experiments are representative of n>3 independent experiments. * indicates p < 0.05. ** indicates p < 0.01.

