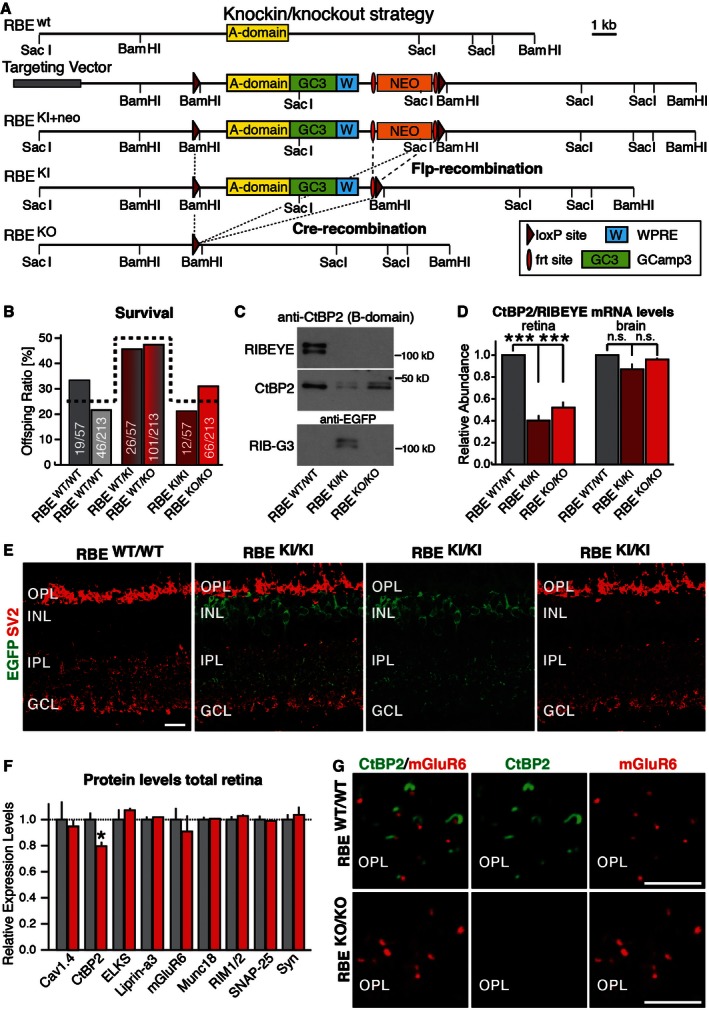
Schematic of the targeting vector. In the vector, the RIBEYE‐specific A‐domain (yellow) is fused to the genetically encoded Ca2+‐sensor GCamP3 (green), followed by a stop codon and the woodchuck hepatitis virus posttranscriptional regulatory element (WPRE, blue) and a PGK‐neomycin resistance cassette (orange) that is flanked by frt sites (red ovals). This entire DNA sequence is flanked by loxP sites (dark red triangles). After homologous recombination into the RIBEYE locus (RBE
KI+neo), Flp‐recombinase (introduced via transgenic expression) removes the selection cassette to generate the RBE
KI allele. Subsequently, Cre‐recombinase excises the entire A‐domain and its accompanying sequences to produce the KO allele (RBE
KO). Selected restriction sites are shown.
RIBEYE mutations do not alter mouse survival. Data show surviving postweaning mice (at > P21) derived from matings between mice heterozygous for the RBE
KI allele (dark red) or the RBE
KO allele (bright red) normalized for the total number of mice (absolute numbers per genotype/absolute number of all mice per respective breeding strategy). The expected Mendelian ratio is indicated by the dashed line. Statistical analysis using the chi‐square test revealed no statistical difference between wild‐type and mutant mice (RBE
KI allele P = 0.33; RBE
KO allele P = 0.11).
Representative immunoblot of retina homogenates from homozygous RBE
WT/WT, RBE
KI/KI and RBE
KO/KO mice probed with antibodies to CtBP2 (to detect the B‐domain of RIBEYE and CtBP2) and to EGFP (to detect GCamP3 in the RIBEYE A‐domain GCamP3 fusion protein referred to as RIB‐G3).
Measurements by RT–PCR of the relative abundance of CtBP2 and RIBEYE mRNAs using an assay that simultaneously measures both mRNAs in retina and in brain from control wild‐type mice (RBE
WT/WT), KI mice expressing the RIBEYE A‐domain fusion protein with GCamP3 (RBE
KI/KI), and KO mice (RBE
KO/KO). These measurements were performed to test the relative expression of RIBEYE and CtBP2 in retina and to examine whether the RIBEYE A‐domain KO impairs CtBP2 expression in brain, which expresses little RIBEYE. Assays are based on a qRT–PCR strategy detecting mRNAs containing the spliced connection between exons 2 and 3 which is common to both transcript isoforms (RIBEYE and CtBP2). Statistical analyses were performed using Student's t‐test; data are presented as mean ± SEM (***P < 0.001; n = 4 mice per genotype).
Representative immunofluorescence labeling of cryostat sections from littermate wild‐type and RBE
KI/KI mice for EGFP (green, to detect GCamP3 in RIB‐G3) and SV2 (red, to label synapses) demonstrates expression of the A‐domain/GCamP3 fusion protein in knockin mice (OPL, outer plexiform layer; INL, inner nuclear layer; IPL, inner plexiform layer; GCL, granule cell layer). Scale bar: 5 μm.
Levels of CtBP2 and of synaptic proteins in retina homogenates from littermate RBE
WT/WT and RBE
KO/KO mice. Levels were determined by quantitative immunoblotting using fluorescently labeled secondary antibodies; results are normalized to loading controls depending on molecular weights (actin, fodrin, VCP, and GDI) and to wild‐type controls. Statistical analyses were performed using Student's t‐test; data are presented as mean ± SEM (*P < 0.05; n = 4 mice per genotype).
Immunofluorescence labeling for CtBP2 (green, to label RIBEYE) and mGluR6 (red, to label photoreceptor synapses) in cryostat sections from littermate RBE
WT/WT and RBE
KO/KO mouse retinas demonstrates that the KO abolishes RIBEYE expression (OPL, outer plexiform layer). Scale bars: 5 μm.