-
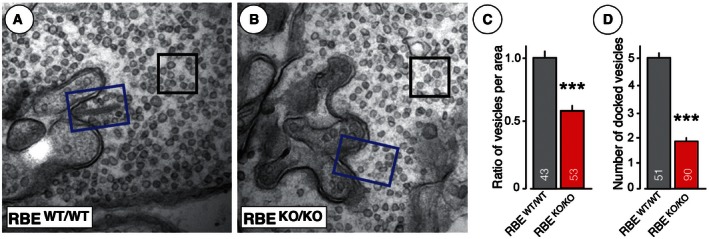
A, B
Representative transmission EM pictures of RBE
WT/WT (A) and RBE
KO/KO (B) photoreceptor ribbon synapses (blue rectangles, area adjacent to synaptic junction used for measuring junction‐associated vesicle density [size = 200 nm × 300 nm]; black squares, area in the presynaptic cytosol used to measure cytosolic synaptic vesicles [size = 200 nm × 200 nm]).
-
C
Average vesicle ratio expressed as vesicle numbers in the area adjacent to synaptic junctions (blue rectangle) or the cytosol (black square) normalized to RBE
WT/WT.
-
D
Average number of docked vesicles within a 150‐nm range in the vicinity of the active zone.
Data information: Statistical analyses were performed using Student's
t‐test; data are presented as mean ± SEM (***
P < 0.001; numbers of analyzed synapses are indicated in the bars).

