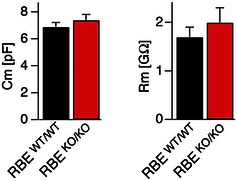
Figure EV6. Capacitance and input resistance values of patched retinal AII amacrine cells.

Neuronal capacitance (left) and input resistance (right) recorded from AII amacrine cells of RBE WT/WT and RBE KO/KO mice. Data are presented as mean ± SEM; numbers of cells analyzed are the same as for Fig 6. No statistical significance was observed between wild‐type and KO cells as assessed by Student's t‐test.
