-
A
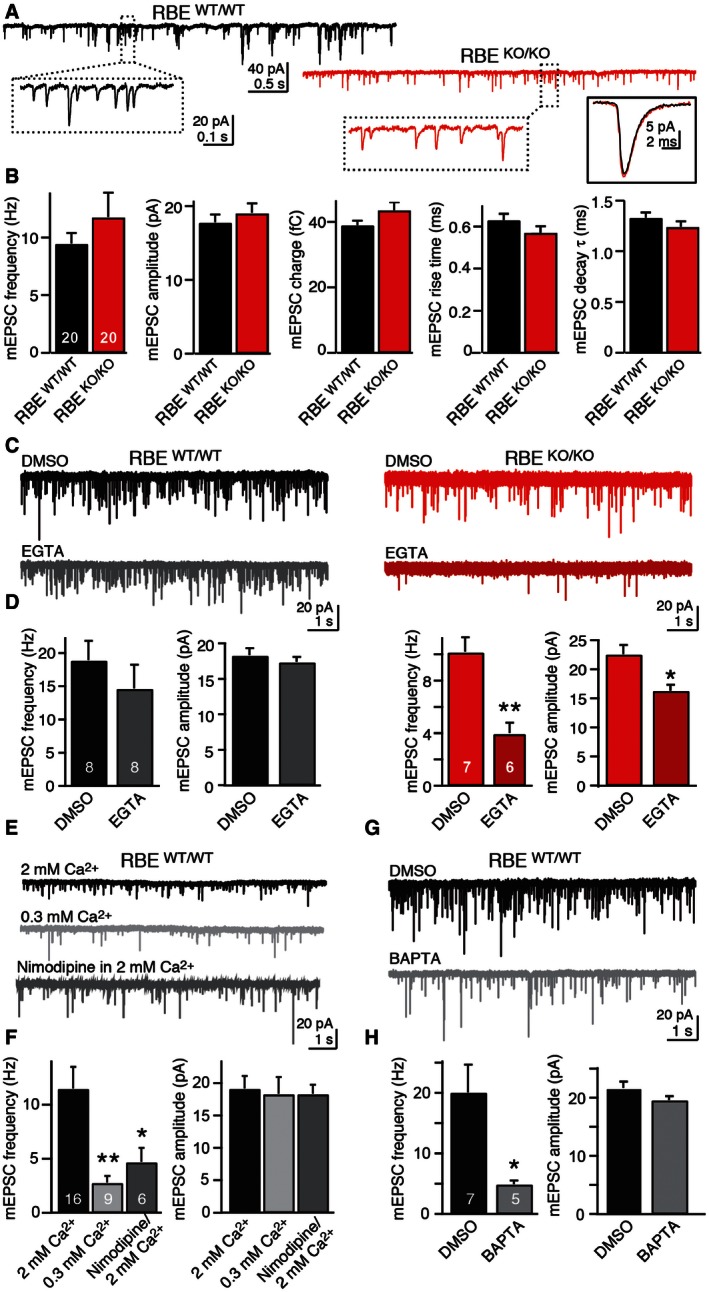
Representative mEPSCs recorded from AII cells in wild‐type (black) and RIBEYE KO mice (red). The insets in dashed boxes show mEPSCs on expanded scales, while the inset in a continuous box on the right shows the averaged mEPSC waveforms (average of 100–200 isolated mini events) of the example cells. Calibration bars apply to wild‐type and mutant EPSCs.
-
B
RIBEYE KO does not alter fundamental parameters of mEPSCs. Summary graphs show mean mEPSC frequency, amplitude, integrated charge, rise time, and decay time constant. Note that the only excitatory inputs into AII amacrine cells are provided by bipolar cell synapses.
-
C, D
RIBEYE KO renders mEPSCs sensitive to the slow Ca2+‐buffer EGTA (C, representative mEPSCs traces recorded from AII cells after 30‐min incubation in DMSO or EGTA‐AM [0.2 mM]; D, summary graphs of the mean mEPSC frequency (left) and amplitude (right) after incubation in DMSO or EGTA‐AM).
-
E, F
mEPSCs in AII amacrine cells are largely triggered by Ca2+‐influx via presynaptic L‐type Ca2+ channels (E, representative mEPSCs traces recorded in regular [2 mM] or reduced extracellular Ca2+‐concentration [0.3 mM], or in the presence of nimodipine [50 μM] in regular Ca2+; F, summary graphs of the mean mEPSC frequency and amplitude under the conditions described for E).
-
G, H
mEPSCs in AII amacrine cells are suppressed by the fast Ca2+‐buffer BAPTA (G, representative mEPSCs traces recorded after 30 min incubation with DMSO or BAPTA‐AM [30 μM]; H, summary graphs of the mean mEPSC frequency and amplitude under the conditions described for G).
Data information: Data are presented as mean ± SEM; numbers of AII amacrine cells recorded are shown in the bars. Statistical significance was assessed by Student's
< 0.01).