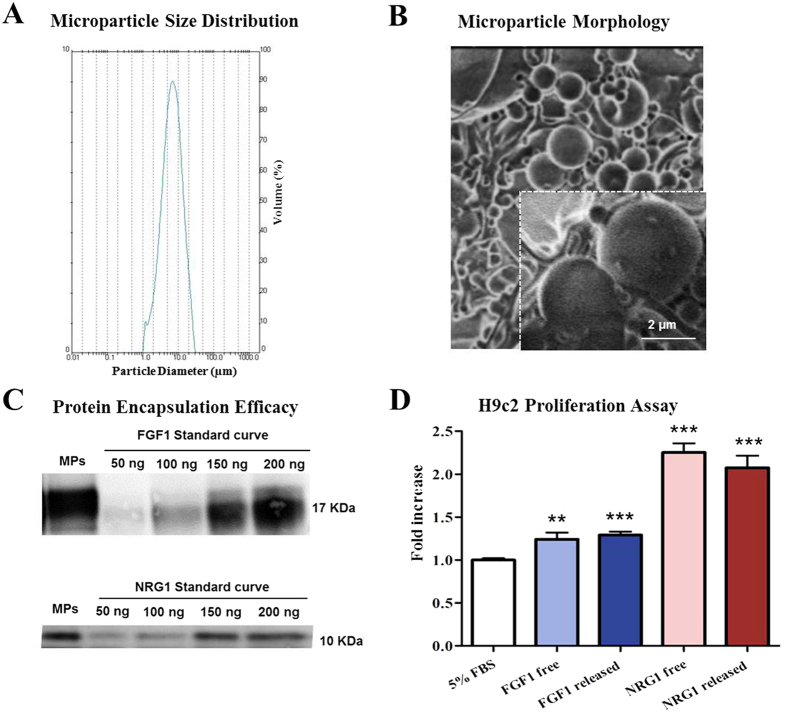
Figure 1. Characterization of injectable MPs loaded with FGF1 and NRG1.
(A) MP size distribution. (B) Scanning electron microscopy images showing the morphology of MPs. (C) Encapsulation efficiency. Western blot bands corresponding to FGF1/NRG1 standard curve and FGF1/NRG1 encapsulated in MPs (D) In vitro effect of MP-released cytokines on heart-derived cells. H9c2 cells were cultured in the presence of either MP-released or free FGF1 and NRG1. Values are the mean fold-increase in cell number over a 72-h period ± SEM from three independent experiments. (One–way ANOVA with a post-hoc Tukey’s multiple comparison test; **p < 0.01 ***p < 0.001).

