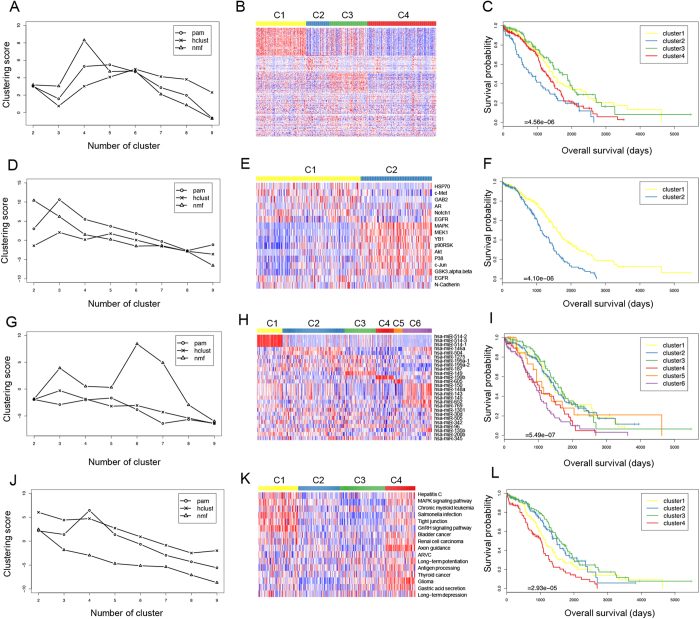
Figure 2.
DNA methylation of (A) three different unsupervised clustering methods, (B) heatmap of 201 CpG sites among four subtypes, and (C) survival curves of four subtypes. Protein expression of (D) three different unsupervised clustering methods, (E) heatmap of 16 proteins among two subtypes, and (F) survival curves of two subtypes. MiRNA expression (based on the sequencing platform) of (G) three different unsupervised clustering methods, (H) heatmap of 38 miRNAs among six subtypes, and (I) survival curves of six subtypes. Pathways of (J) three different unsupervised clustering methods, (K) heatmap of 16 pathways among four subtypes, and (L) survival curves of four subtypes. Rows in the heatmaps were ordered by their significance of up-regulation in each cluster. Features not significantly up-regulated in any cluster were moved to the end of the map.

