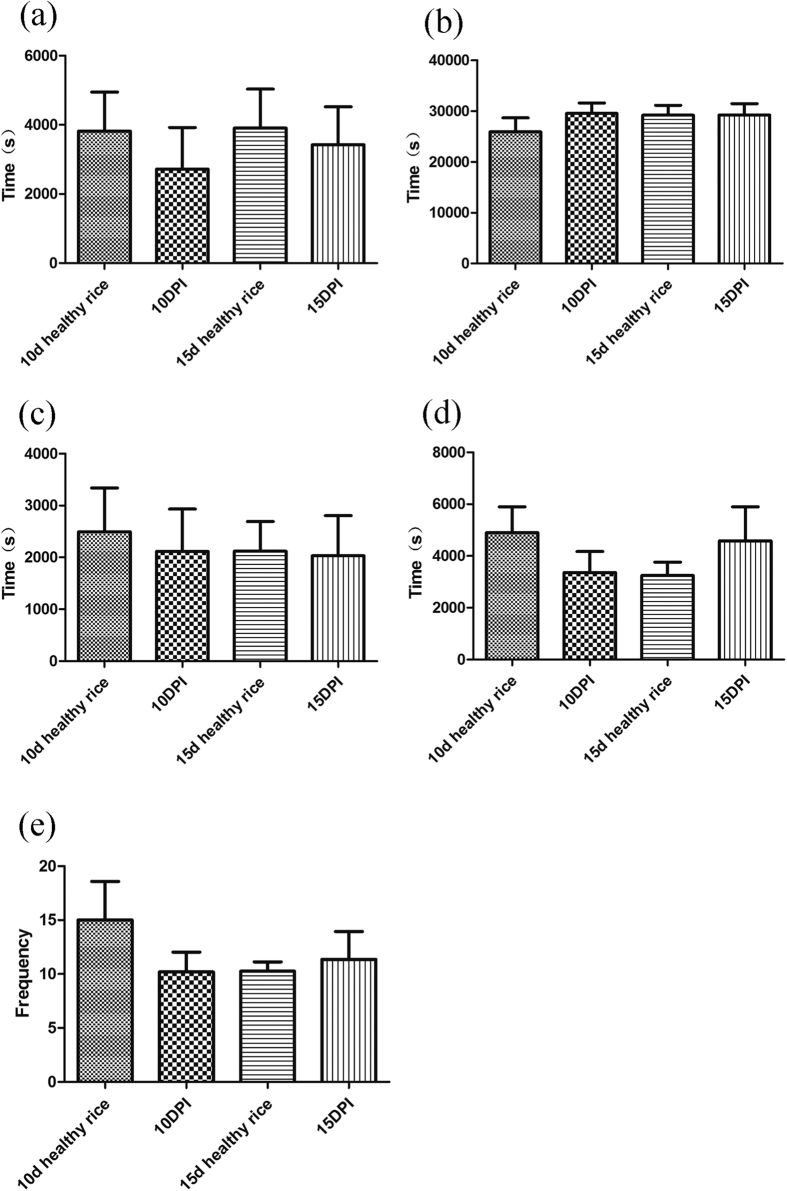
Figure 2. BPH activities as identified by electrical penetration graph (EPG) recordings within the first 12 h at 10 and 15 days after Xoo infestation (mean ± SE, n = 9–15).
PI: plants infected by Xoo. (a) Time interval to 1st N4a. (b) Total duration of N4b. (c) Total duration of np. (d) Total duration of ph. (e) Total number of ph. Waveform: np (non-penetration), ph (path way waveform), N4a (sieve element salivation), N4b (ingestion in phloem).

