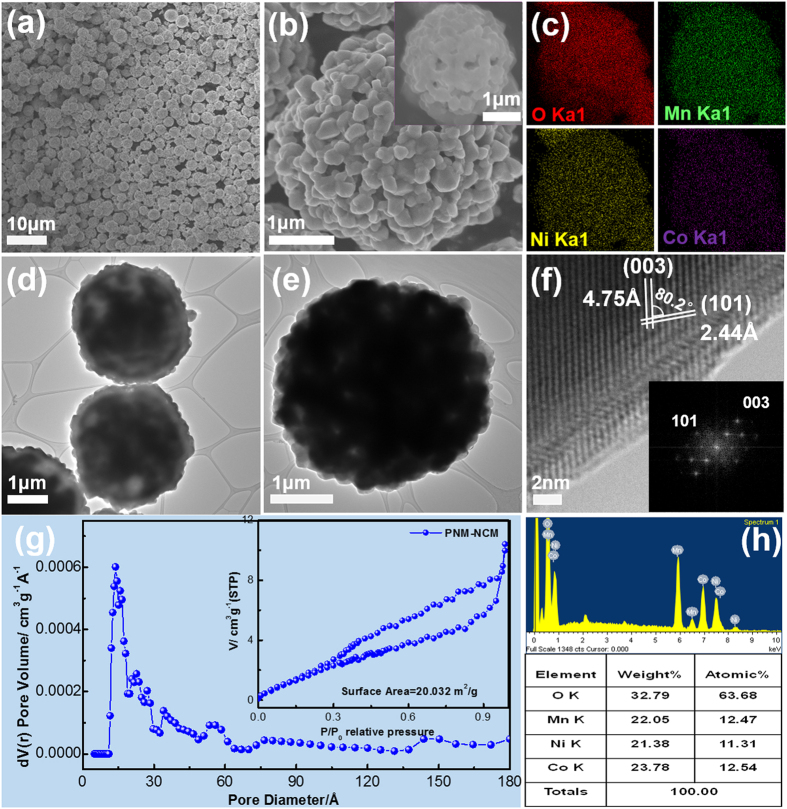
Figure 3.
Typical FESEM images of (a,b) PNM-NCM at different magnifications; (c) EDS mappings of oxygen, manganese, nickel and cobalt; (d–f) TEM and HR-TEM images of PNM-NCM; (g) the pore size distribution, and N2 adsorption/desorption isotherms of PNM-NCM; (h) EDS spectrum and results of PNM-NCM microspheres.

