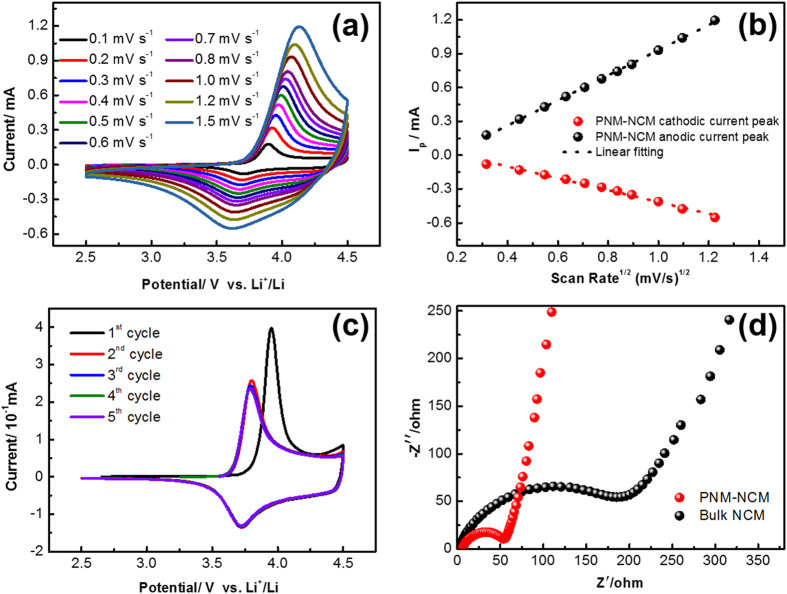
Figure 7.
(a) Cyclic voltammetric profiles at various scan rates of 0.1–1.5 mV s−1; (b) Linear response of the peak current density as a function of the square root of scan rate of PNM-NCM; (c) The first five consecutive cyclic voltammograms curves at a scan rate of 0.1 mV s−1 in the voltage range 2.5–4.5 V versus Li+/Li, (d) Nyquist plots over the frequency range from 0.1 kHz to 100 kHz of PNM-NCM (red curve) and Bulk-NCM (black curve) electrodes.

