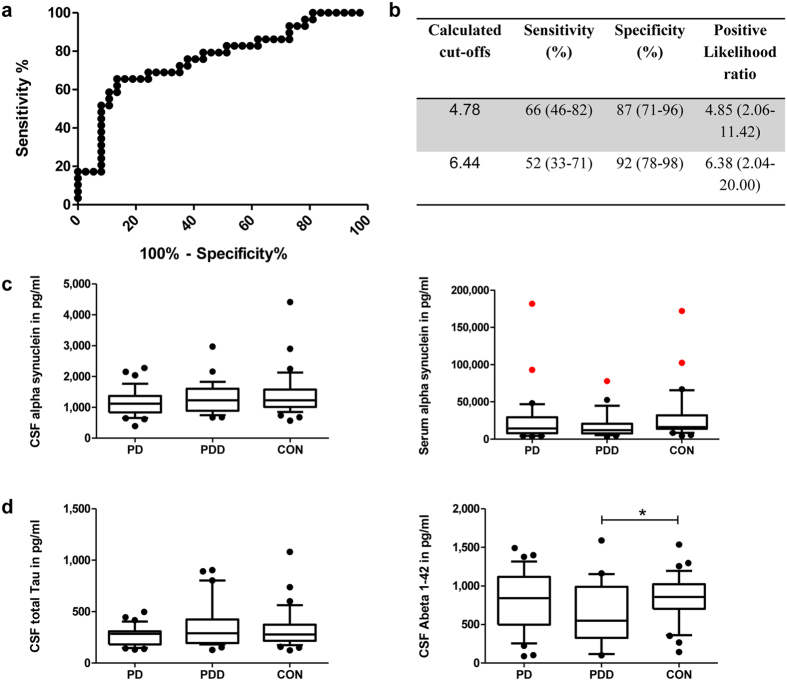
Figure 4. ROC of normalized peak 0 and display of alpha-synuclein, tau and Abeta 1–42 levels.
(a) Receiver operating characteristics (ROC) curve of normalized peak 0 from PD vs. PDD. 37 PD and 29 PDD patients were analysed. Area under the curve: 0.76. (b) Calculated cut-offs with corresponding sensitivity, specificity and positive likelihood ratio for the normalized area of peak 0 from PD and PDD. 95% confidence interval in brackets. (c) Display of alpha-synuclein levels in CSF (left) and serum (right) of PD, PDD and control samples. Red colour indicates serum samples that were contaminated with erythrocytes and were thus considered outliers. These samples were excluded from further analyses. No significant differences between the three groups were found. (d) Display of total Tau levels in CSF (left) and Abeta 1–42 (right) of PD, PDD and control samples. Only the Abeta 1–42 levels of control and PDD samples showed a statistically significant difference . In the box plots the median concentrations are shown, 25% and 75% percentile, and 10% and 90% whiskers. CON, control; PD, Parkinson’s disease; PDD, Parkinson’s disease with dementia.

