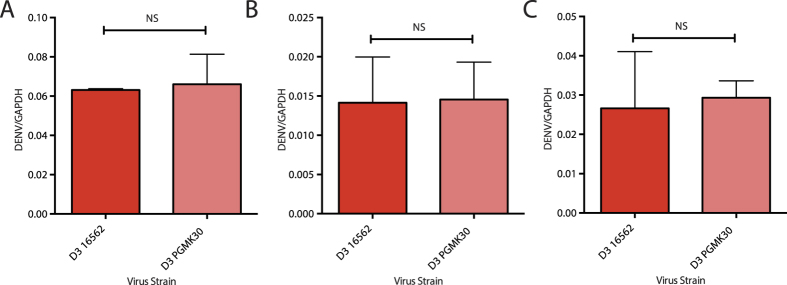
Figure 3. Viral RNA 2 hpi measured by qPCR of DENV-3 infections.
(A) DENV-3 RNA in pronase-treated Huh-7 cells. (B) DENV-3 RNA in THP-1 cells infected via antibody-dependent pathway. (C) DENV-3 RNA in Raji cells expressing the DC-SIGN receptor. In all cases, the amount 16562 and PGMK30 uptake by cells were similar. All data points were calculated from at least 4 biological replicates; Error bars indicate standard deviation. P-values were calculated using a two-tailed t-test; *indicates p < 0.05 and **indicates p < 0.01 respectively.

