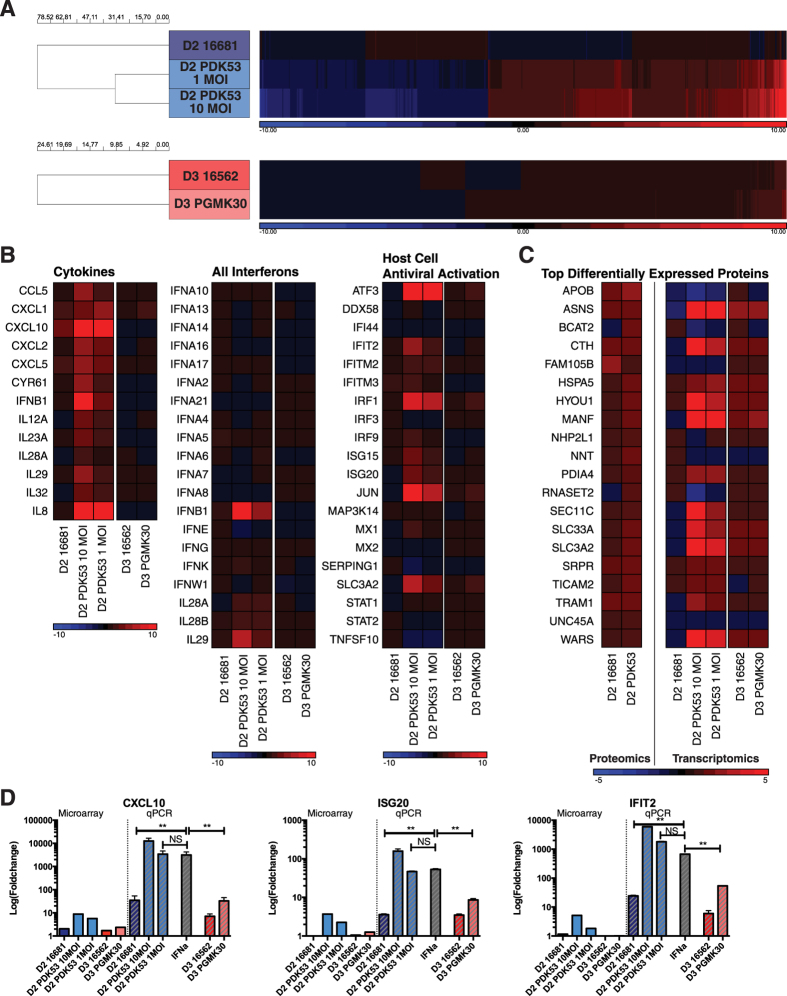
Figure 4. Host cell responses to infection with different DENV strains.
(A) Unbiased whole genome microarray hits of significant transcriptomic changes in infected HuH-7 cells (>2-fold change relative to uninfected cells, corrected p-value <0.05) showing how only PDK53, whether at 1MOI or 10MOI, induced significant changes in gene transcription relative to uninfected cells. Cells infected by PGMK30 and both wild-type strains at 10MOI remained largely unperturbed by infection. Upregulated genes are depicted in red, and downregulated genes in blue. (B) Transcription changes in HuH-7 cells detected by microarray of selected genes, grouped by antiviral function. Only PDK53 consistently upregulated antiviral gene expression. Few changes were observed in PGMK30 relative to 16562 infection. (C) Translational differences (left heat map) and their corresponding microarray transcript levels (right heat map) of the most differentially enriched proteins in HuH-7 cells infected with either 16681 or PDK53. (D) mRNA levels of selected ISGs measured by qPCR of infected primary human monocytes (right side of graph), alongside their corresponding microarray transcript values of infected Huh-7 cells (left side of graph). Error bars indicate standard deviation. P-values were calculated using a two-tailed t-test; *indicates p < 0.05 and **indicates p < 0.01 respectively.

