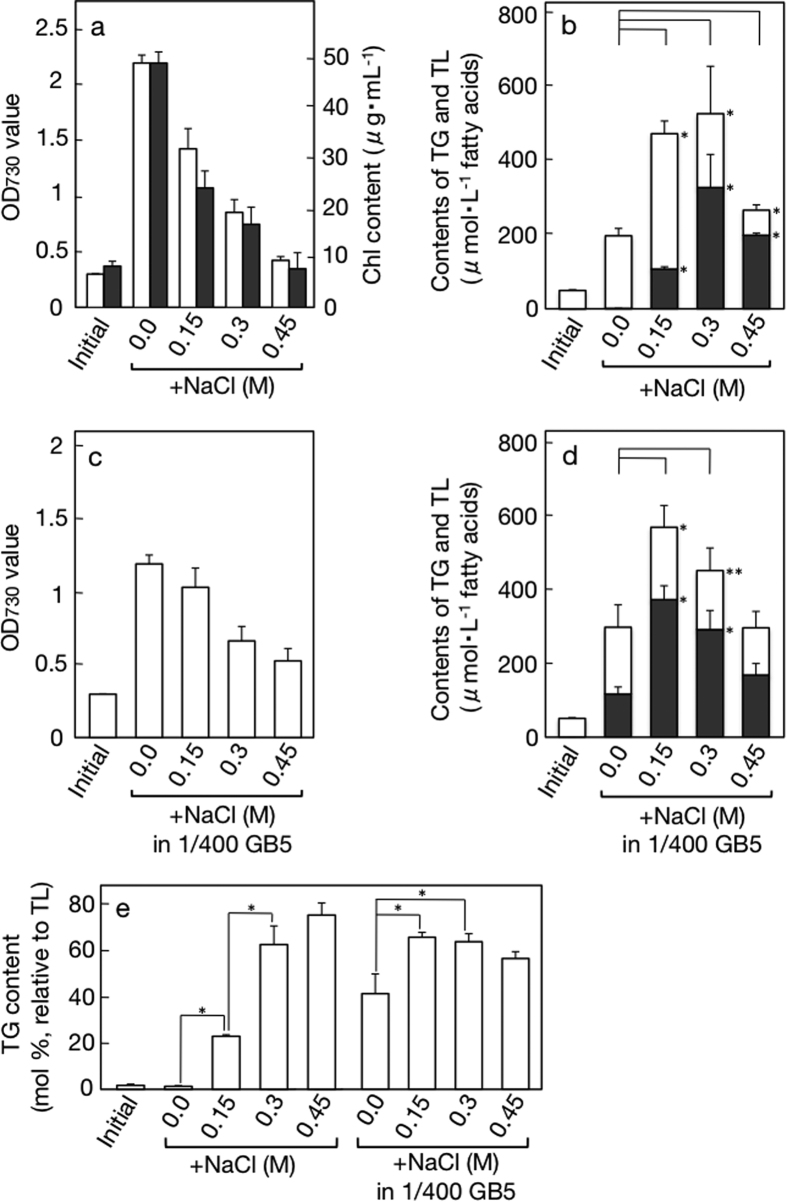
Figure 2. Effects of NaCl-induced hyperosmotic, nutrient-limiting or combinatory stress on cell growth and TG accumulation in C. kessleri.
The cells were cultured for 2 days under hyperosmotic conditions for measurement of (a) OD730 values (open bars) or Chl contents (closed bars), and (b) the contents of TG (closed bars), TL (see top values of open bars), and therefore polar lipids (open bars) in the cultures. The cells were cultured for 2 days under nutrient-limiting or combinatory stress conditions for measurement of (c) OD730 values and (d) the contents of TG (closed bars) and TL (see top values of open bars) in the cultures. (e) TG contents relative to TL, on the basis of fatty acids, estimated from data of (b) or (d). The values shown are the averages ± SE for three distinct groups of data. ‘Initial’ in (a–e) indicates the initial level. The values shown are the averages ± SE for three distinct groups of data. The values of ‘initial’ and control are the same as those in Fig. 1. The significance of differences was evaluated by Student’s t test. *P < 0.05. **P < 0.1. In (b,d), see differences in the TG or TL content between 0.0, and 0.3, 0.6 or 0.9.

