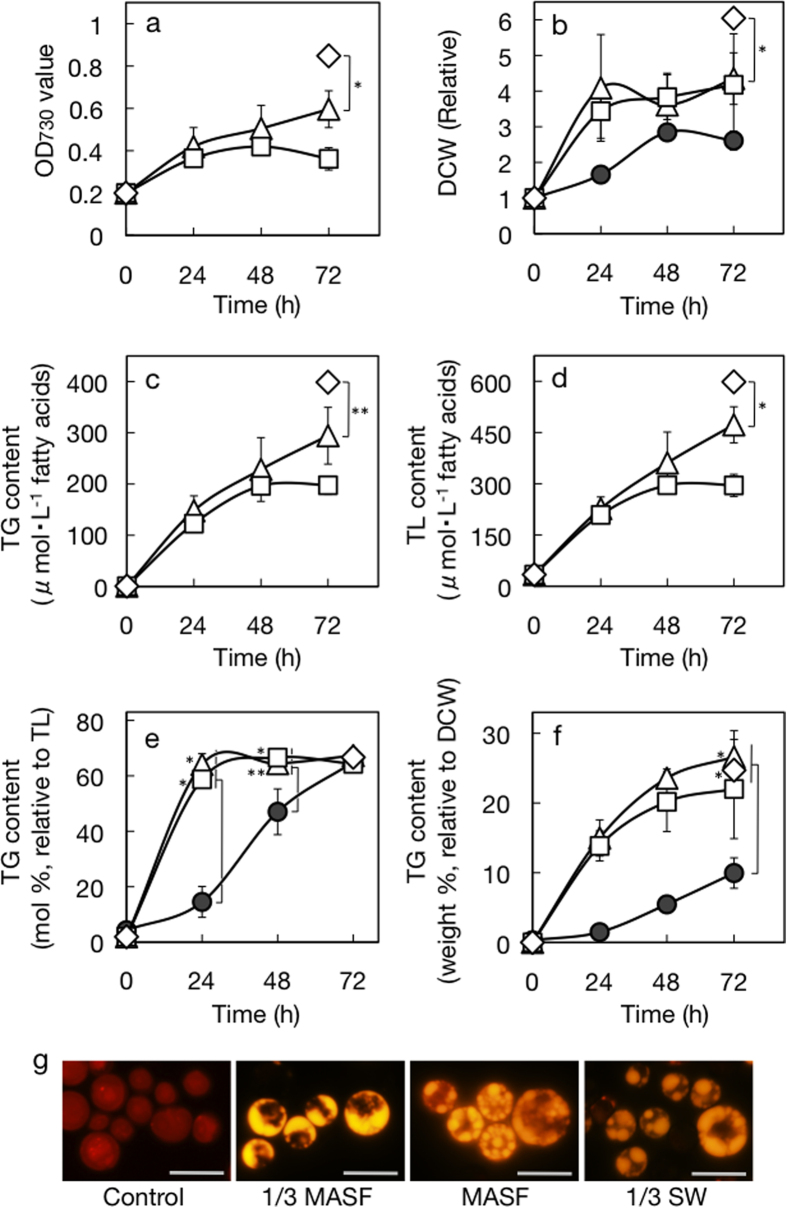
Figure 5. Effects of hyperosmotic stress, with the use of seawater, on cell growth and TG accumulation in C. kessleri.
The cells were grown for 3 days in 1/3 MASF (triangles) or MASF (squares) medium, or 1/3 SW (diamonds), and then subjected to the following measurements. (a) OD730 values of the culture. The initial levels of OD730 were adjusted to 0.2. (b) Dry cell weights relative to the initial level. (c) TG contents in the culture. (d) TL contents in the cultures. TG contents relative to TL (e) or dry cell weight (f). Our previous data for the air-drying cells (closed circles) are also included in (b,e,f)9. The values in (e,f) were estimated from data of (c,d), and those of (b,c), respectively. The measurements were performed every other day for the cultures in 1/3 MASF or MASF medium, and once on Day 3 for the culture in 1/3 SW. (g) Nile-red stained lipid droplets in cells stressed with or without the use of seawater. White bars represent 10 μm. The values shown are the averages ± SE for three distinct groups of data. The significance of differences was evaluated by Student’s t test. *P < 0.05. **P < 0.1. In (e,f), see differences in the TG content between air-drying and seawater-stressed cells, at respective time points.

