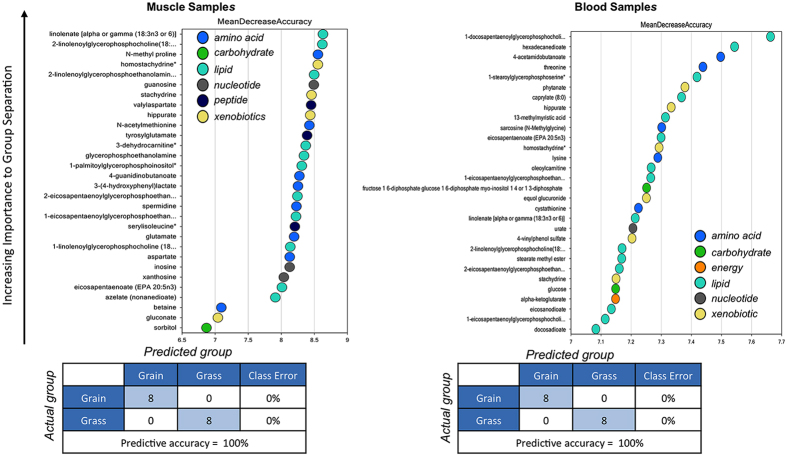
Figure 7. Random forest analyses obtained from muscle and blood.
Random forest analysis consists in a supervised classification technique based on an ensemble of decision trees that has proven to be a valuable statistical tool for identifying biomarkers of interest. Random forest analysis based on the biochemicals detected in this dataset resulted in a predictive accuracy of 100% between dietary conditions. This value is greater than random chance (50%), suggesting these metabolites may be of interest as biomarkers. The y-axis represents the molecules in order of importance for group classification, from top to bottom. The legend represents the type of biochemical and the table below each chart shows the prediction accuracy based on the random forest result (actual against predicted group).

