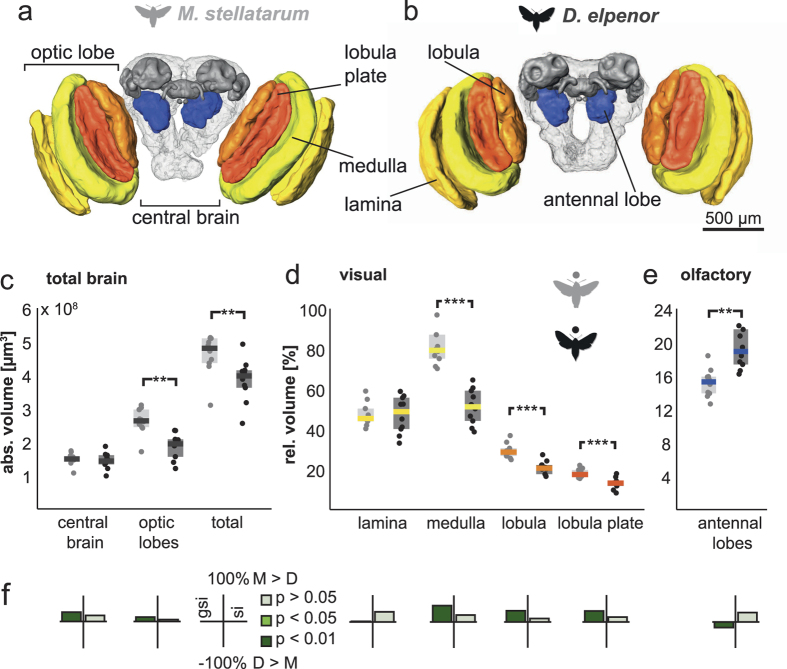
Figure 1. Lower-order visual and olfactory neuropils in M. stellatarum and D. elpenor.
Posterior view of 3D reconstructed neuropils of the diurnal (a) and nocturnal (b) species. Lower-order structures in colour, higher-order neuropils in grey, remaining central brain neuropil in light grey. Absolute (c) and relative (d,e) neuropil volumes of the total brain (c) and visual (d) and olfactory (e) structures, respectively. Grey (diurnal) and black (nocturnal) circles show individual measurements, shaded areas interquartile ranges and horizontal bars medians (colour coded as in a,b). Significance tests with Mann-Whitney-U test: *p < 0.05, **p < 0.01, ***p < 0.001. (f) The grade shift index (gsi) illustrates scaling differences in neuropil volume between species (positive values: M. stellatarum > D.elpenor, negative values: vice versa), while the slope ratio (si) shows a divergence of the respective neuropil from isometric scaling with respect to the central brain. Significance is indicated by the colour. For full results and statistics see Supplementary Tables S1, S2.

