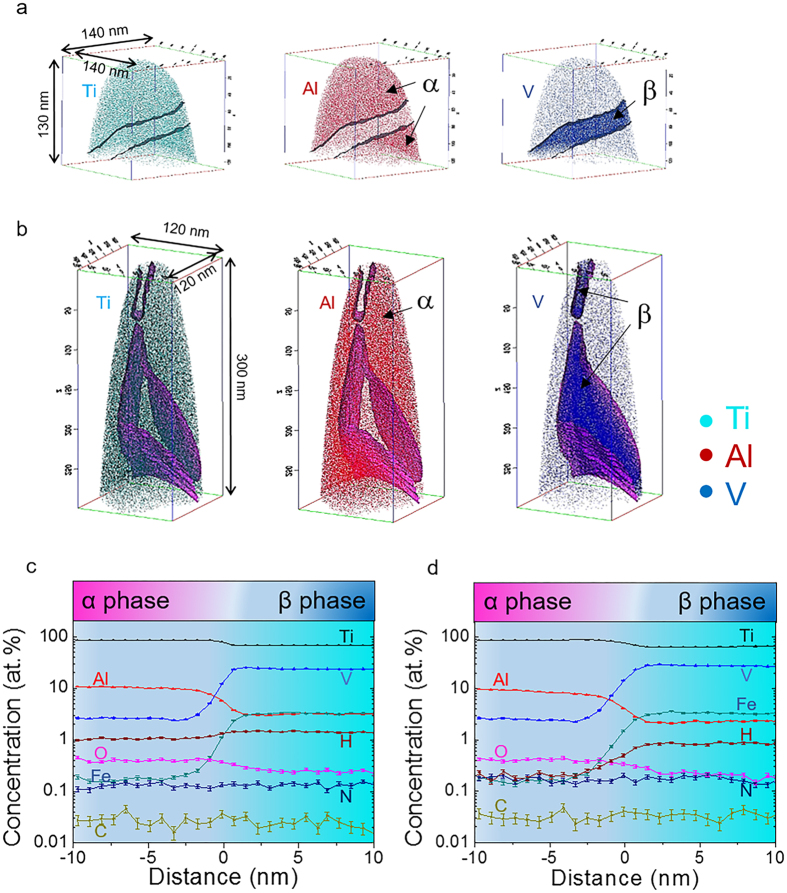
Figure 3. Full decomposition of α′ martensite in the thick EBM-printed Ti-Al-4V samples.
(a,b) Elemental mappings of Ti, Al and V in 10 mm and 20 mm samples, respectively. 13 at.% and 16 at.% V iso-concentration surfaces (iso-surfaces) were adopted in the APT reconstructed volumes of 10 mm and 20 mm samples, respectively. The values of 13 at.% and 16 at.% were chosen because they approximately enable the solvent elemental concentrations in α and β phases lie midpoint in the proxigrams. α and β phases can be clearly distinguished as the former is rich in Al and the latter rich in V. No martensite was observed, indicative of full martensitic decomposition occurs. (c,d) Proxigrams showing elemental partitioning behavior across α/β interfaces in (a,b), respectively. Partitioning behavior of each element and quantitative compositions of α and β phases are easily obtained from the proxigrams.

