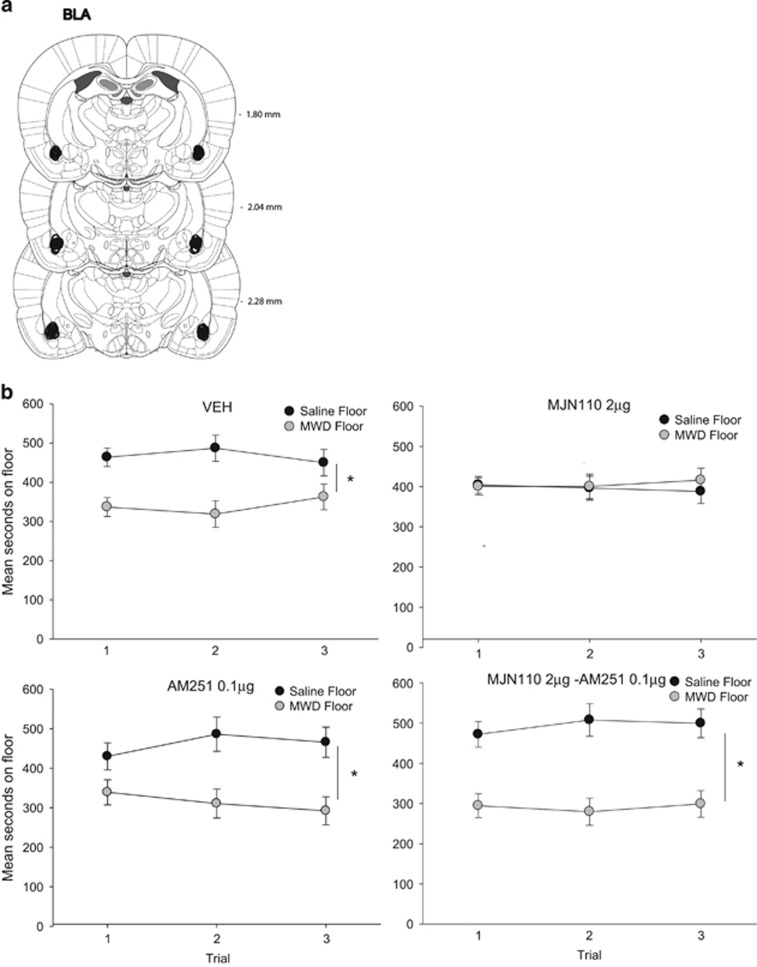
Figure 3.
(a) BLA cannula placements for all rats included in the experiment. (b) Mean (±SEM) time spent in seconds on the saline-paired floor and the MWD-paired floor for each pretreatment drug group (VEH, 2 μg MJN110, 0.1 μg AM251, 2 μg MJN110–0.1 μg AM251 into the BLA during conditioning) during each 15 min test trial. Asterisks indicate a significant difference between the saline and morphine withdrawal paired floors. *p<0.05.

