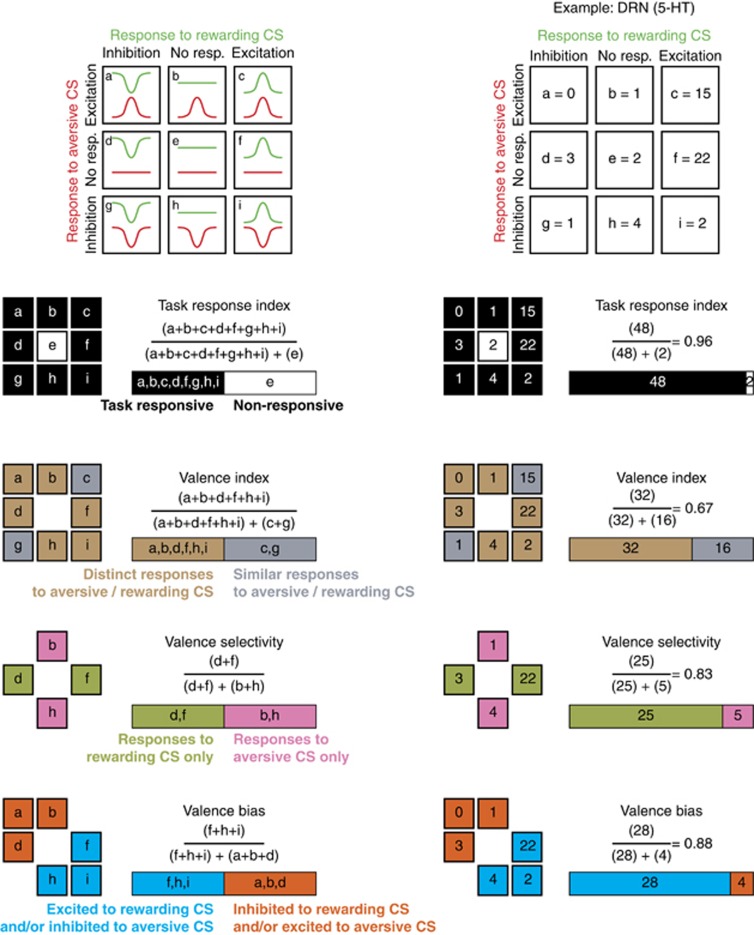
Figure 2.
A model for quantifying valence representation. The above figure illustrates the process for computing metrics from single-unit recording studies to examine valence representation. The right column illustrates the process of applying the model to a population of neurons. In this case, we apply the model to serotonin neurons in the dorsal raphe nucleus (DRN), based on the results from Cohen et al (2015). A neuron can be qualitatively classified into non-responsive, excited, or inhibited to a conditioned stimulus (CS). In a typical valence-conditioning paradigm, there is a positive CS, predictive of an appetitive outcome, and a negative CS, predictive of an aversive outcome. Given these definitions, there are nine possible disjoint base classes for each neuron, as illustrated above (a–i). To compare the valence representation between brain regions, we define the following classes of neurons, based on the nine base classes. Task response index is the proportion of task-responsive neurons. Valence index is the proportion of differentially responsive neurons (neurons that either have opposite responses to each valence or a selective response to one valence), among the task-responsive neurons. Valence selectivity is the number of neurons selectively responsive to reward (d,f), relative to the number of neurons selectively responsive to either valence. Valence bias is the ratio of number of neurons excited by a positive CS and/or inhibited by a negative CS to the number of neurons having distinct responses to each valence. Each computed parameter in the model is color-coded for ease of visualization, and the meaning of each color is presented in the left column.

