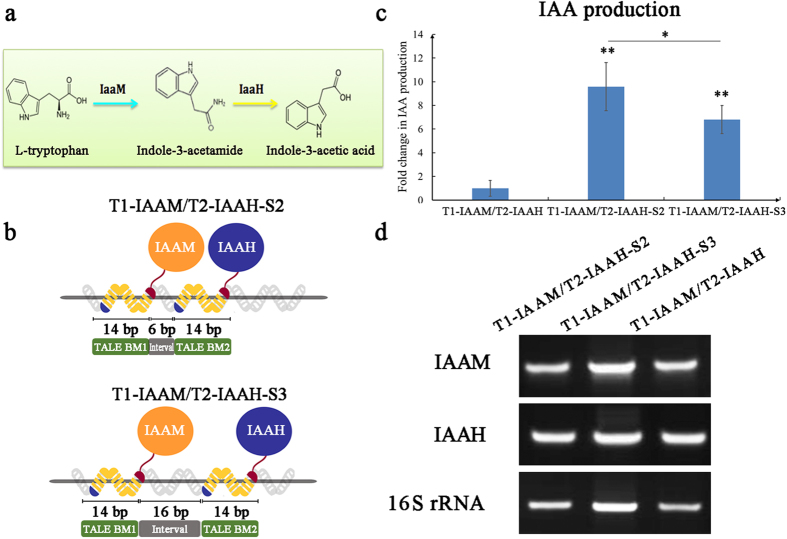
Figure 3. Increase in IAA production by incorporating IAAM and IAAH into the TALE–DNA scaffold system.
(a) The IAA production pathway converts L-Trp into IAA through IAAM and IAAH. (b) Schematic of the manner of integration of IAAM and IAAH into the TALE–DNA scaffold system and their hypothetical binding patterns to the DNA motifs. The designed DNA BMs are shown at the top left of each panel. These patterns include the “BM1-interval-BM2-interval” pattern with 6 bp (middle panel) and 16 bp intervals (lower panel). (c) IAA production was determined by sandwich ELISA after overnight culture of E. coli with IPTG induction. After TMB staining and reaction termination, the color was measured spectrophotometrically at 450 nm wavelength. IAA concentrations in the samples were then determined by comparing their OD450 to standard curves. The relative IAA concentration of the TALE1–IAAM/TALE2–IAAH no-scaffold control group was set arbitrarily at 1.0, and the levels of the other groups were adjusted correspondingly. Data represent the results obtained from at least three independent experiments. *p < 0.05, **p < 0.01. (d) Semi-qRT-PCR analysis of IAAM and IAAH expression in different TALE–IAA–scaffold groups. The cDNA sequence of 16S rRNA was amplified as the standard.

