
Table 1.
County-level distribution (n=3,140 counties) of variables used to generate each county health factor in the County Health Rankings, United States, 2000–2008a
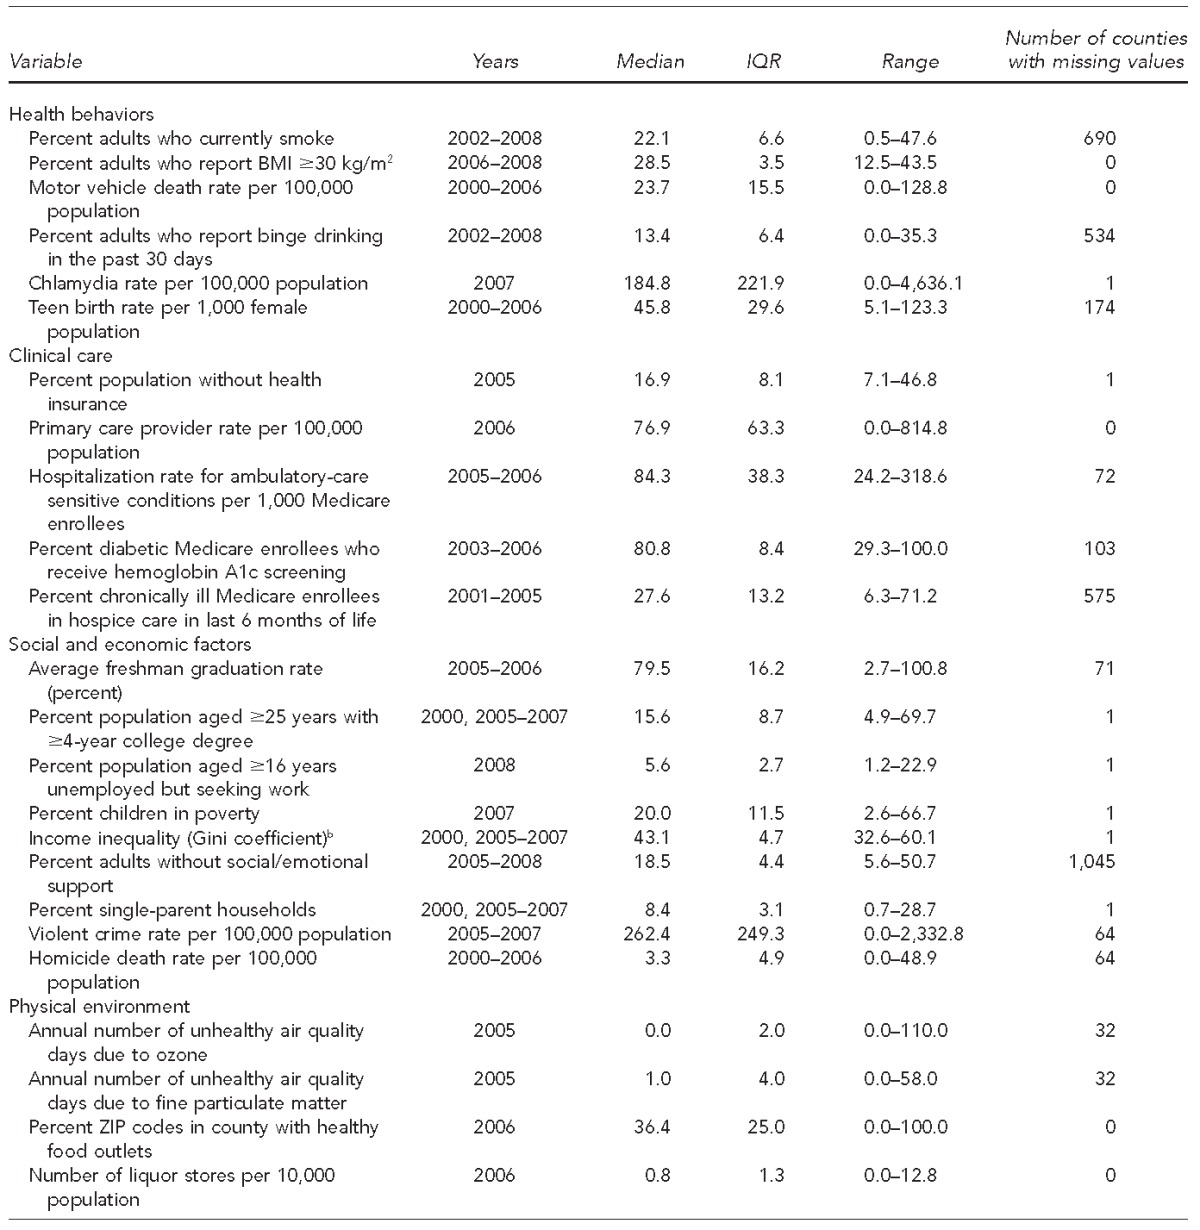
Source: Robert Wood Johnson Foundation. County Health Rankings & Roadmaps [cited 2016 Feb 23]. Available from: http://www.countyhealthrankings.org
bThe Gini coefficient of income inequality represents the inequitable distribution of income in a community by household, and can range from 0 to 1. The County Health Rankings multiplies the Gini coefficient by 100, so that the values can range from 0 to 100. A value of 100 indicates that all income in a county is concentrated in one household, while a coefficient of 0 indicates a completely equal distribution of income among households.
IQR = interquartile range
BMI = body mass index
kg/m2 = kilogram per square meter