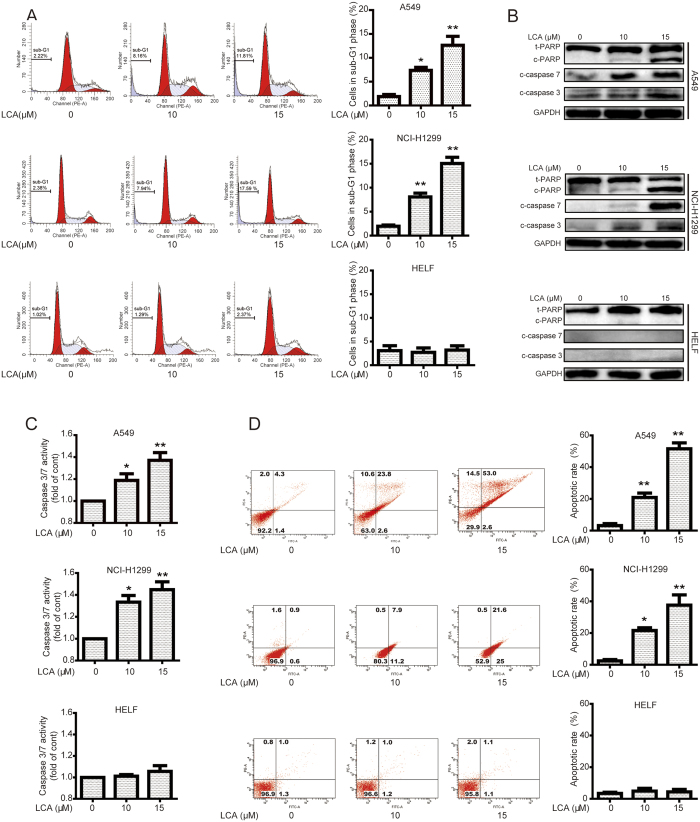
Figure 2. LCA induced apoptosis in NSCLC cells while not in normal cells.
(A) Cells were treated with indicated concentrations of LCA for 24 h. The cells in sub-G1 phase were evaluated by flow cytometry. *P < 0.05 and **P < 0.01. (B) After treatment with LCA for 24 h, cells were analyzed to determine indicated changes of proteins by western blot analysis. The blots were run under the same conditions and the full-length blots were shown in supplementary materials. (C) Cells were treated with LCA for 24 h, and the activation of caspase 3/7 was determined using a commercial kit. *P < 0.05 and **P < 0.01. (D) After treatment with LCA for 24 h, apoptotic cells were stained with annexin V/PI and analyzed by a flow cytometry. *P < 0.05 and **P < 0.01.

