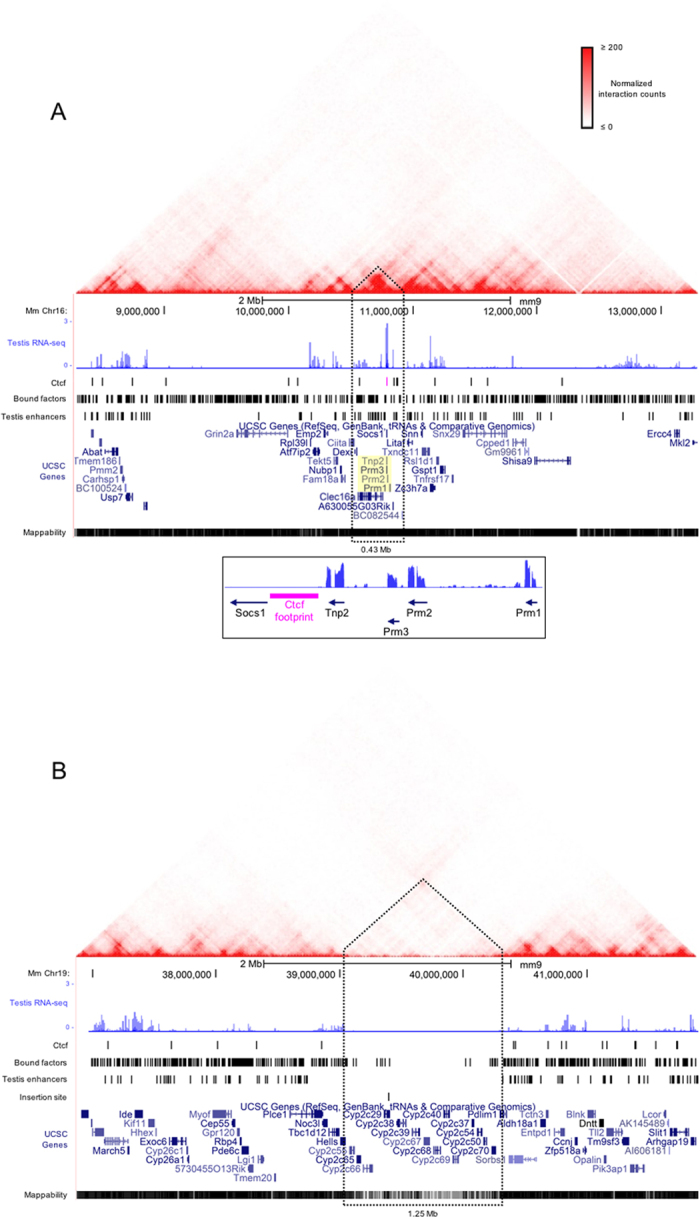
Figure 4. The chromatin domains harboring the abundantly expressed endogenous protamine locus and the suppressed transgenes exhibit different regulatory features.

The relative positioning of cis regulatory elements and testis RNA-seq coverage along 5 Mb regions centered on (A) the mouse protamine locus (inset) or (B) the transgene insertion site (chr19:39,397,384-39,397,385), is presented within the context of intra-chromosomal contact data from Hi-C analyses of CH-12 cells12. Mean coverage of uniquely aligned sequencing reads from total transgenic testes RNAs (n = 4) aligned to the wild type mouse genome are presented as log10 normalized values. Nuclease footprints corresponding to Ctcf and other factors bound in mature mouse sperm are displayed as separate tracks. The Ctcf footprint positioned between Socs1 and Tnp2 is highlighted in pink. The protamine gene cluster and ~2 kb Ctcf footprint is displayed in a separate lower panel. Predicted testis single nucleotide enhancer peaks were provided by the mouse ENCODE project36. The locations of the endogenous protamines are highlighted in yellow. The site of transgene insertion within mouse chromosomes 19 is marked on a separate track. Peaks of Hi-C interaction frequencies containing the loci of interest are demarcated by dashed lines and are considered chromatin subdomains. (Inset) The endogenous protamine gene cluster is displayed along with the Ctcf footprint (pink) identified between Socs1 and Tnp2.
