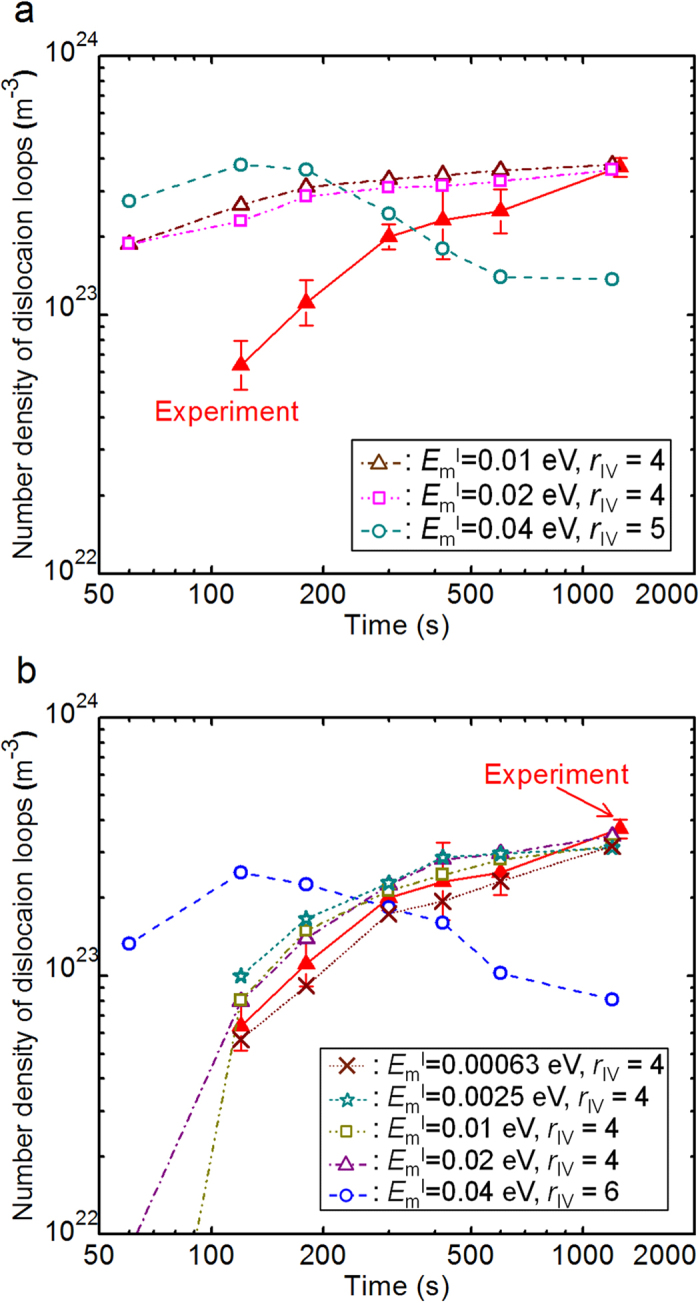
Figure 4. Representative OKMC simulation results.

We searched for parameter sets reproducing the experimental result shown in Fig. 2c from among the restricted parameter sets, as shown in Fig. 3. Representative temporal variations in the number density of the dislocation loops are shown for (a) SIA migration dimension: 3D, rII = 11.0, rIX = 0.0 and (b) SIA migration dimension: 1D, rII = 13.0, rIX = 1.0. The rIV, rII, and rIX values are shown as atomic-distance units.
