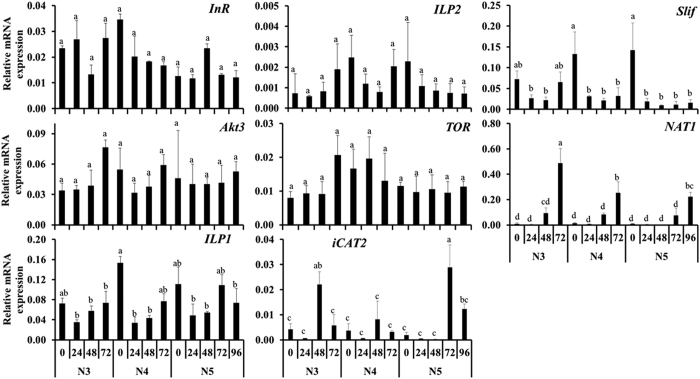
Figure 2. Relative mRNA levels of genes regulating nutrition pathway.
RNA from third (N3), fourth (N4) and fifth (N5) nymphal stages were collected at 24 hr intervals beginning at the time of feeding until they enter next stage. mRNA levels were determined using qRT-PCR and normalized using expression levels of ribosomal protein 8 (rpl8). The relative mRNA levels of Insulin Receptor (InR), RAC-gamma serine/threonine-protein kinase (Akt3), Insulin-like peptide 1 (ILP1), Insulin-like peptide 2 (ILP2), Target of Rapamycin (TOR), insect cationic amino acid transporter 2 (iCAT2), Slimfast (Slif), and probable sodium-coupled neutral amino acid transporter 6 (NAT-1) are shown. Data shown are mean + SD (n = 3). (Alphabets represent significance at 95% CI).

